
How to Create Custom Styles in MapBox
As featured HERE on PowerBI.Tips - the home of the best Power BI tips, tricks and resources!

🎦 Check out our short video tutorial to see all the details in action 🎦
If you’ve played around with MapBox in Power BI – you’ll know that it has loads of great features to create really rich and beautiful maps, including some great ‘out of the box’ map styles (i.e. base maps). However, you might not be aware that it also gives you the ability to design custom styles with your own spatial layers. I discovered this feature on a recent project where my client wanted to include Victoria’s Catchment Management Authority (or CMA) boundaries on their base-map to provide greater context to help interpret their data. Up until this point, the only option I knew of was to purchase an expensive ArcGIS Online licence to create custom map styles. So, you can imagine just how excited I was when I discovered that I could also do this in MapBox – for FREE!!!
There are plenty of reasons to design your own map styles, including:
Provide Context: I touched on this above, but the ability to add your own layers to the backgrounds on your maps goes a long way to providing additional context to help your report users understand and interpret their data.
Simplify: Sometimes you need to peel back the complexity to help your data stand out. Customising base maps allows you to remove unnecessary elements which may distract your users from the data, and dynamically add back complexity at different zoom intervals (watch Step 4 of the Video to see how this works!)
Consistency, Branding, and Themes: Customising the style allows you to design your maps with a similar ‘look and feel’ to other visuals in your report, as well as corporate branding and colour themes. For the passionate Power BI designers out there – you’ll LOVE this feature (we’re always on the hunt for new formatting options in Power BI!)
I’m not going to lie, there are a couple of steps involved in designing your own custom styles for MapBox in Power BI, but believe me – it’s totally worth it! Watch along in the videos (or skip ahead below) as I walk through the key steps.
The case study I present is a Power BI report with three maps to help design our future cities to account for population growth, while also considering our environmental and social values (created using ‘synthetic’ datasets for demonstration purposes only). I modify the default ‘Outdoor’ MapBox style to include my own custom tileset, and show how to create dynamic colour gradients based on different zoom intervals.
STEP 1: Add Chloropleth Map

▶️ Skip ahead in the video to Step 1▶️
The first step is to create a MapBox map, in Power BI using the MapBox custom visual. Now, there’s a couple of steps involved in getting to this stage - so if you’re new to MapBox, or just need a refresher, head across to our MapBox for Power BI 101 video blog where we walk through the key steps:
Add the MapBox custom visual into Power BI
Create a MapBox account and access token
Create a simple circle map
Upload custom ‘tilesets’ to the MapBox Studio
Create a custom ‘Chloropleth’ map (just a fancy name for an area map…)
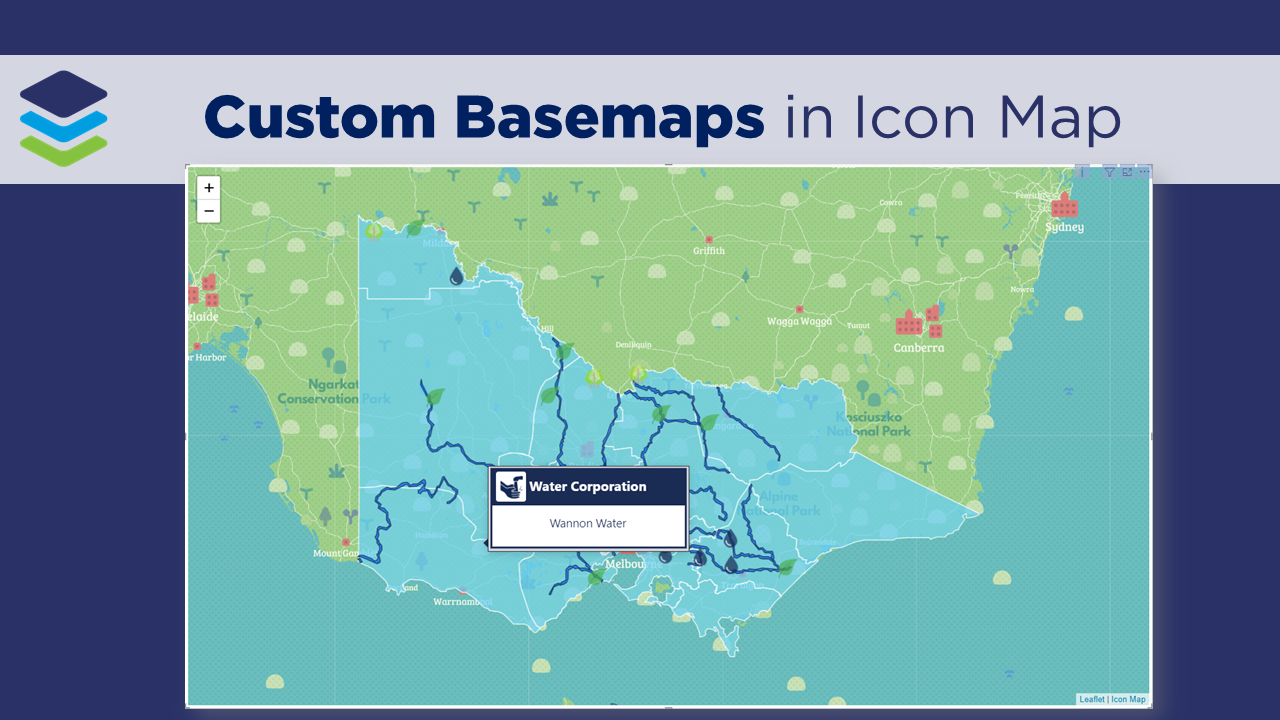
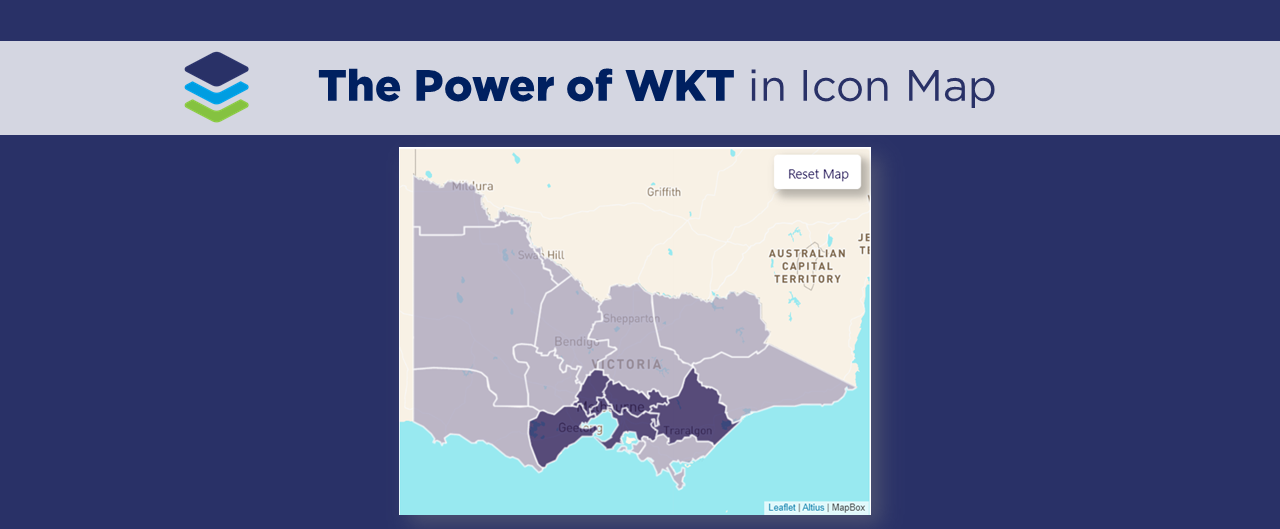
In our example we have developed a chloropleth map drill-down of different river basins and rivers across Melbourne. Each of these river basins lie within a Catchment Management Authority (CMA) boundary, and in our example, while we don’t want to activerly select a CMA boundary, it would be great to show these on the underlying base map to provide additional context to help us interpret the datasets. So that’s where creating custom map styles come in handy!
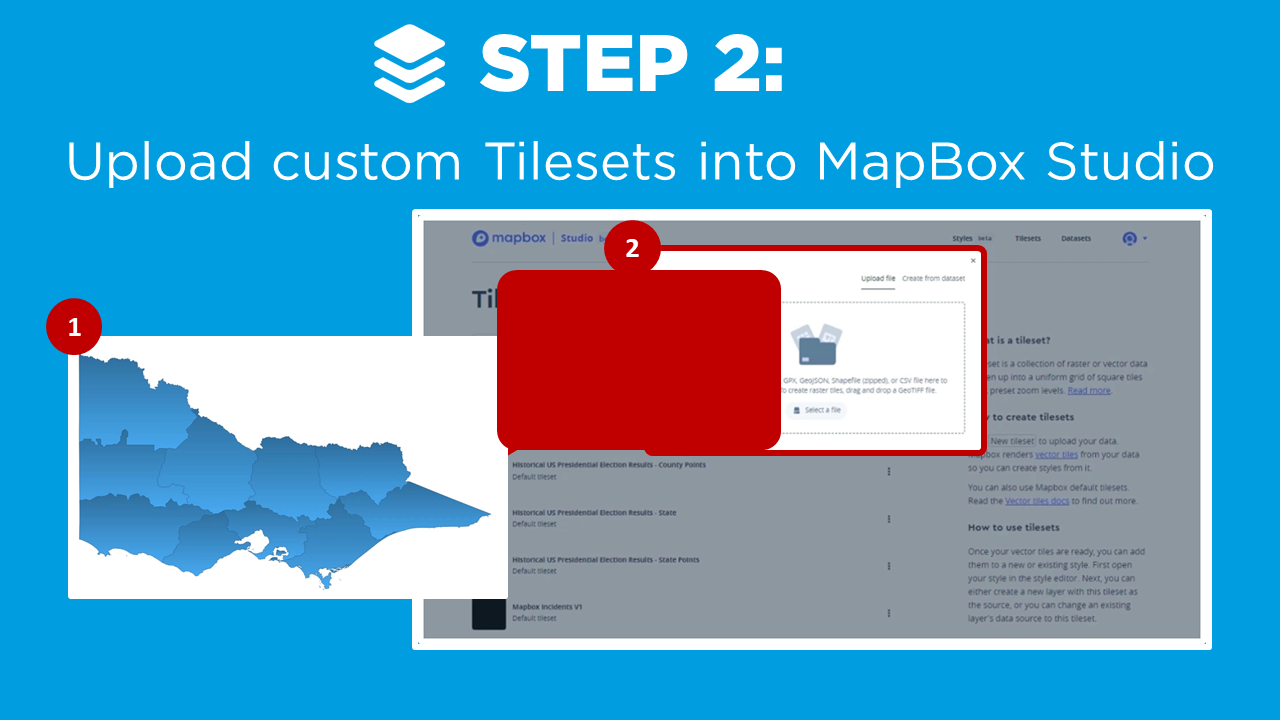
STEP 2: Upload Tileset
▶️ Skip ahead in the video to Step 2 ▶️
To create a custom map style, we would typically want to include some of our own spatial files that are unique to our data. In my case, this is the CMA boundaries, which I have as a Shapefile (.shp format). Now we need to upload this file as a custom tileset to the MapBox studio. You can do this by the following steps:
Log-in to your MapBox Studio account (watch Step 2 of our MapBox for Power BI 101 video blog if you need to set up an account)
Navigate to the Tilesets section, and upload your file.
Note: When uploading shapefiles, you first need to zip the .shp file with supporting files, and then upload the package - more info on the types of files that can be uploaded as tilesets is presented in the MapBox Tutorial Documentation.
STEP 3: Duplicate Style

▶️ Skip ahead in the video to Step 3 ▶️
MapBox has a few template Map Styles in the ‘Styles‘ tab in MapBox Studio. Rather than reinventing the wheel, the easiest way to get started is duplicating an existing MapBox style from the gallery. To do this:
Navigate to the ‘Styles‘ tab in MapBox Studio
Select New Style.
Chose from one of the existing styles (my favourite is ‘Outdoors) to modify, or if you’re a mapping wiz, you can design your own style from scratch by selecting ‘Blank’
Selecting ‘Customise’ takes you to the MapBox Styles editor - which we’ll go over in more details in Step 4.
But always remember to rename your style (top left).
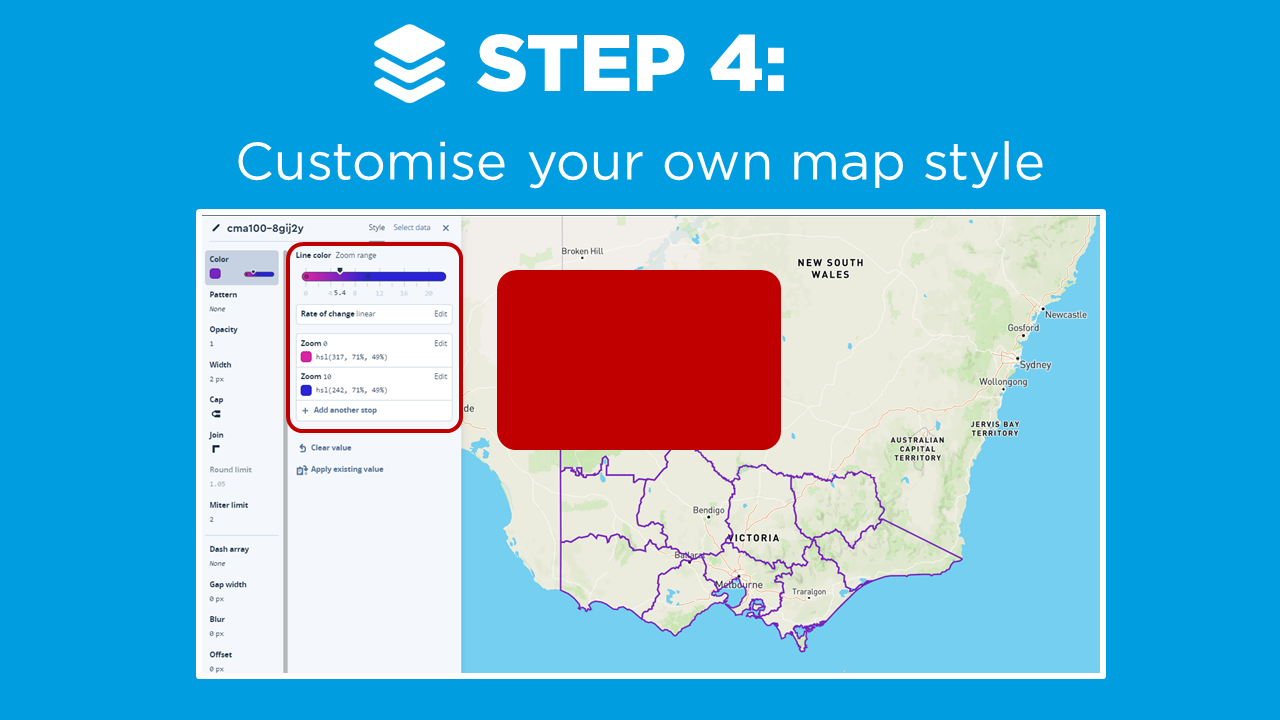
STEP 4: Customise
▶️ Skip ahead in the video to Step 4 ▶️
Now we have our Style - let’s get creative and customise it! There are loads of different options, such as adding or removing new elements, changing the zoom styles or adding points of interest, so just play around with it.
In our example, we’re keeping it pretty simple, and walk through how to add our your own tileset to your map (i.e. the CMA Boundaries) and how to dynamically adjust the style based on the zoom intervals.
Select the Plus symbol to add a new layer, and browse to our tileset
Adjust the Type (i.e. fill, filled extrusion, line, circle, symbol, heatmap)
Adjust the style (i.e. colour, pattern, opacity, stroke width, etc.)
Get dynamic - change the styles based on zoom level, attributes, functions, or formulas!
Once you’re finished editing, select ‘Publish’ and you’re good to go! Now we just have to add it into Power BI.
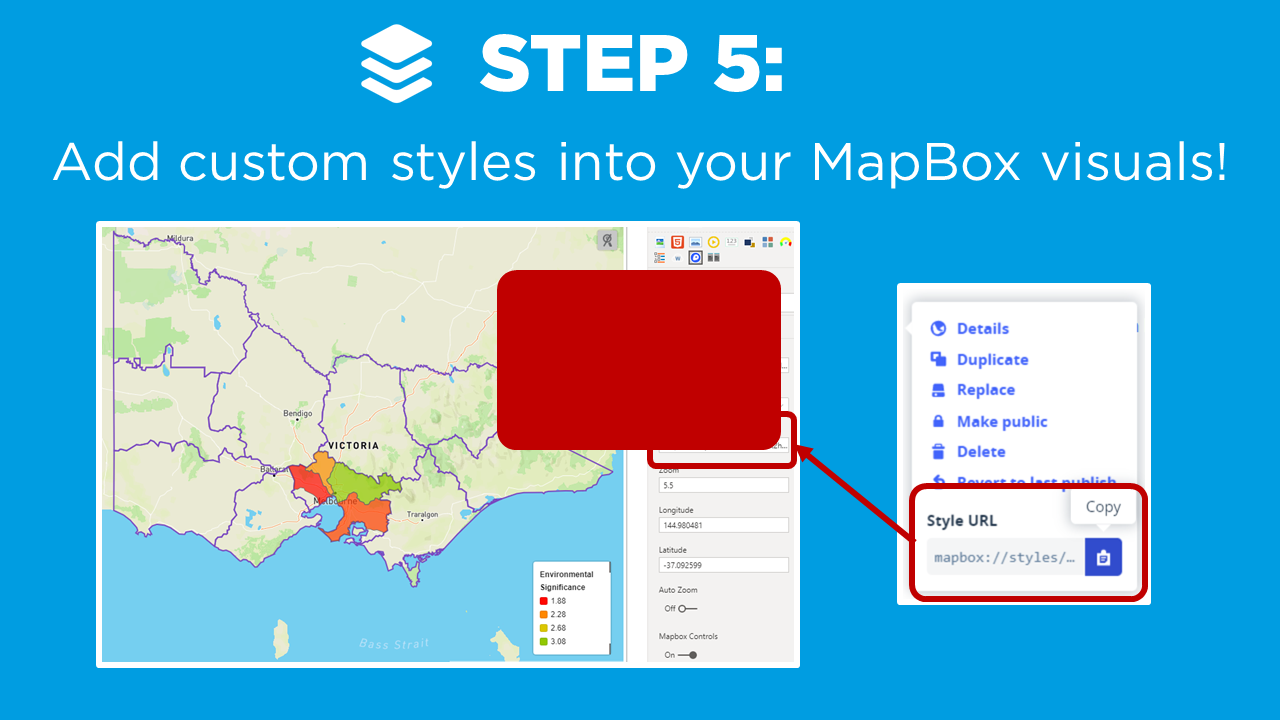
STEP 5: Add to Power BI
▶️ Skip ahead in the video to Step 5▶️
Now for the fun part - adding our custom style into our MapBox visual in Power BI:
In MapBox Studio Styles page, select the 3-dot ellipsis to the top of your Style copy the Style URL.
Back in Power BI, select the MapBox Visual, navigate to the ‘Format’ panel and ‘Viz Settings’.
Under the ‘Map Style’ select ‘Custom’ and paste the Style URL from the clipboard.
And that is it! You now have your own custom style in your MapBox visual!
In Summary…
By applying these 5 steps, we’ve created our own custom styles for MapBox in Power BI.
How can you apply the MapBox visual to show data in your own Power BI projects?
Please post in the comments below - we’d love to hear from you!
Power BI Design Training Course
We’re really excited to announce DiscoverEI’s new Power BI training courses are now available. Get in touch today to learn more and secure your place!
Purchase Training


Do you want to learn how to design engaging and intuitive Power BI reports, which communicate your key insights at a glance and tell your data story?
Our two-day Power BI training course is designed specifically for Power BI Professionals and Data Analysts, and provides our best practice tips, tricks and hacks to help you transform your data! We provide this course online, in-person group sessions, or customised in-house training for your team. Places are limited (max 8 participants per class) so secure your spot today!