
Power of a Prototype: 5 Tricks to Shape YOUR Power BI data Story

🎦 Check out the full M365 conference presentation here 🎦
In late May 2020, Alice and I had the chance to present ‘virtually‘ at the M365May conference on the “Power of Prototypes: Shaping your data story“. Yes the old prototype, not everyone’s favourite approach when getting started on a new project. But in this session, we showcased a 5-step quick method for developing a prototype, which allows you as the analyst to really engage with your clients and stakeholders when building Power BI reports, and provide some real benefits for your organisation.
You can watch the entire session in the video above, or keep reading this blog to learn the step-by-step approach.
When we talk about the benefits of prototypes, we are really focusing on two key challenges….
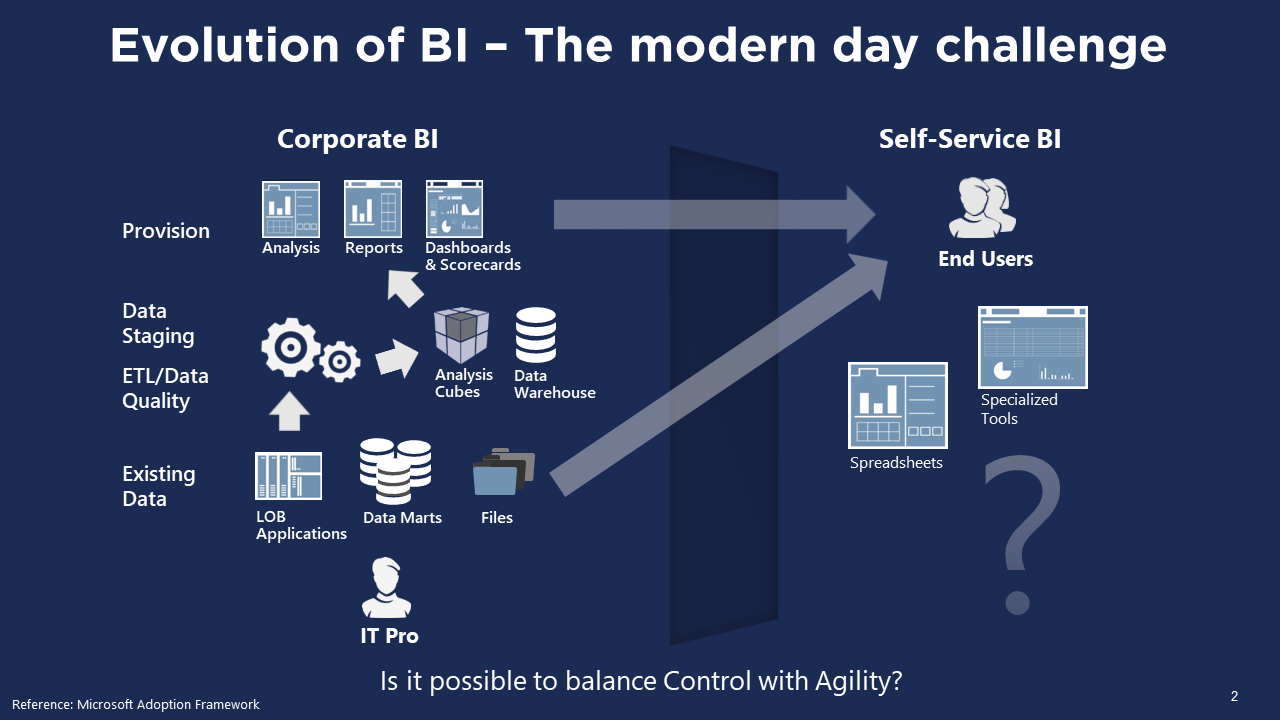
How can analysts and business users effectively leverage BI tools?

How can we effectively communicate during the project?
So what are the 5️ key tips for developing a prototype and successfully delivering on a Power BI project? Before we go through them, we first need to introduce our BI platform and set the scene with our example scenario.
The Tool and Scenario

▶️ Skip ahead in the video to learn about Power BI and today’s scenario ▶️
So in this part of the video, we introduce three elements before explaining the 5 tips:
The Power BI workflow from data ingestion to transform to developing visuals.
The persona of ‘Christian‘ aka the business user at the organisation WaterWorks, and the persona of ‘Alice‘ aka the data analyst.
Share the project scenario they will be working on, which focuses on visualising customer waterway survey results.
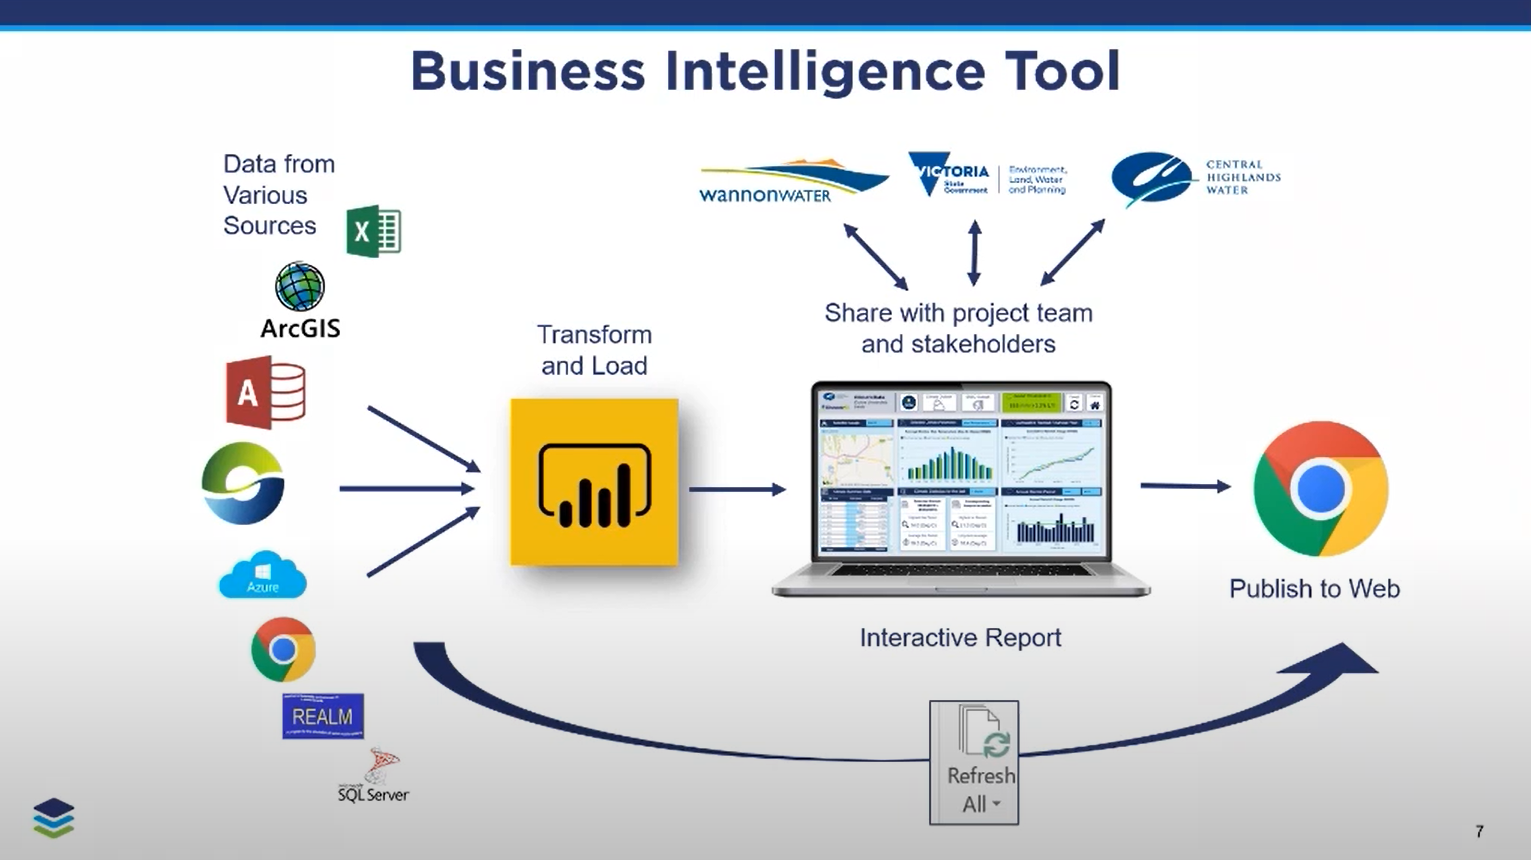
The common Power BI workflow

The role of business user and analyst

The scenario we face today
TIP 1: Start with a Sketch
Tip number 1 is to start with a sketch: This allows you to work with your business users and helps set the business requirements and framework for your report. You can watch the video from Tip 1 to see how it works in practice and how it is valuable for banishing the dreaded Blank Page!!

▶️ Skip ahead in the video to Tip 1 ▶️
TIP 2: Use a Subset of data
Tip number 2 is to use a subset of data: This approach will keep your model smaller, faster and help get you to develop something quickly. It will give you the analyst more freedom, and helps to avoid getting overwhelmed with complex data modelling and developing DAX measures.
It is noted that as analysts’ we should be cautious at this stage. If you are developing the prototype for a large-scale organisation with a sophisticated system, then using a subset of data may not work, and you may encounter challenges with model performance and usability when trying to scale your report. It is always going to be a balance between developing a tool quickly for your organisation, and recognising how this tool may work (or not work) when you scale.
Christopher Wagner (Microsoft Data Platform MVP) is an expert in this area, and I would recommend exploring his page KratosBI if you want to find out more on different approaches for scaling up reports.

▶️ Skip ahead in the video to Tip 2 ▶️
TIP 3: Style your reports!
Tip number 3 is to use styles and themes: Tip #3 is what we LOVE at DiscoverEI: styles, themes and backgrounds to make your reports really stand out!! In this example we present some simple tricks on how to bring better structure to your reports to tell the story, and import themes to use corporate branding. This will make the report more engaging when sharing it across the organisation.

▶️ Skip ahead in the video to Tip 3 ▶️
TIP 4: Get Feedback Early
Tip number 4 is to re-engage and get feedback: Sometimes the business user won’t even know what is possible with Power BI, and won’t know what they want until they see something on the page. That’s why it’s important to re-engage with them to get their updated requirements, especially after they have spoken to other stakeholders in the organisation who are also part of the project!

▶️ Skip ahead in the video to Tip 4 ▶️
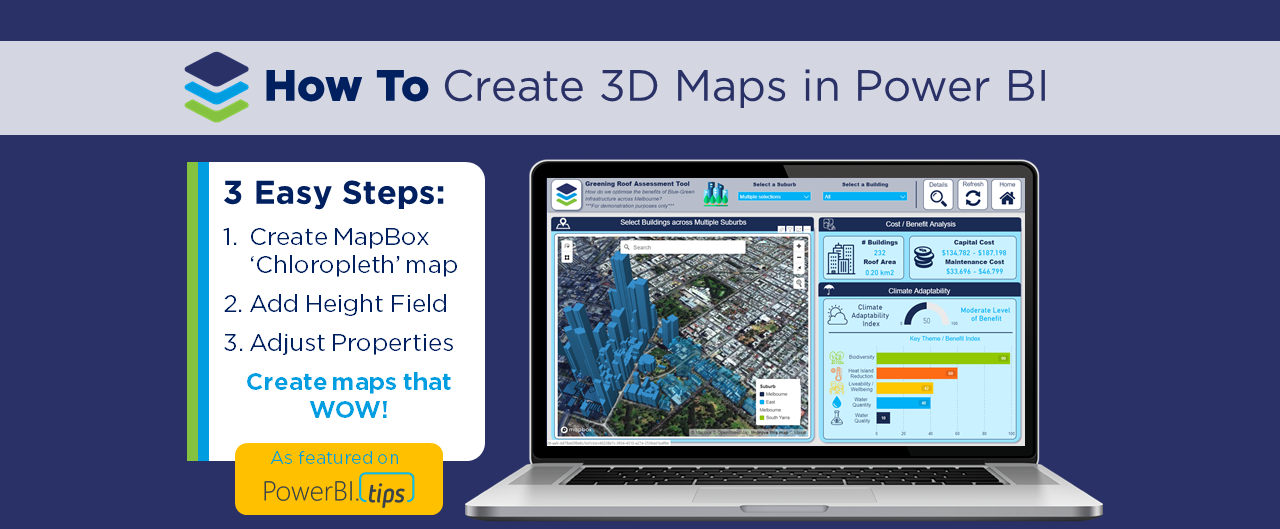
We saw in this example, how simply upgrading visuals using the MapBox, Chiclet Slicer and WordCloud made a big difference to how data was presented and the usability of the tool. We have a whole blog series on using Mapbox: DiscoverEI’s favourite map 😀 - so click on the buttons below to find out more!!


TIP 5: Share, Collaborate, Iterate
Tip number 5 is to share, collaborate and refine: A Power BI App in the online service is a great way to share and collaborate on project report with clients and stakeholders. It allows you to package everything up with supporting information and create that shared understanding!!

▶️ Skip ahead in the video to Tip 5 ▶️
In Summary…
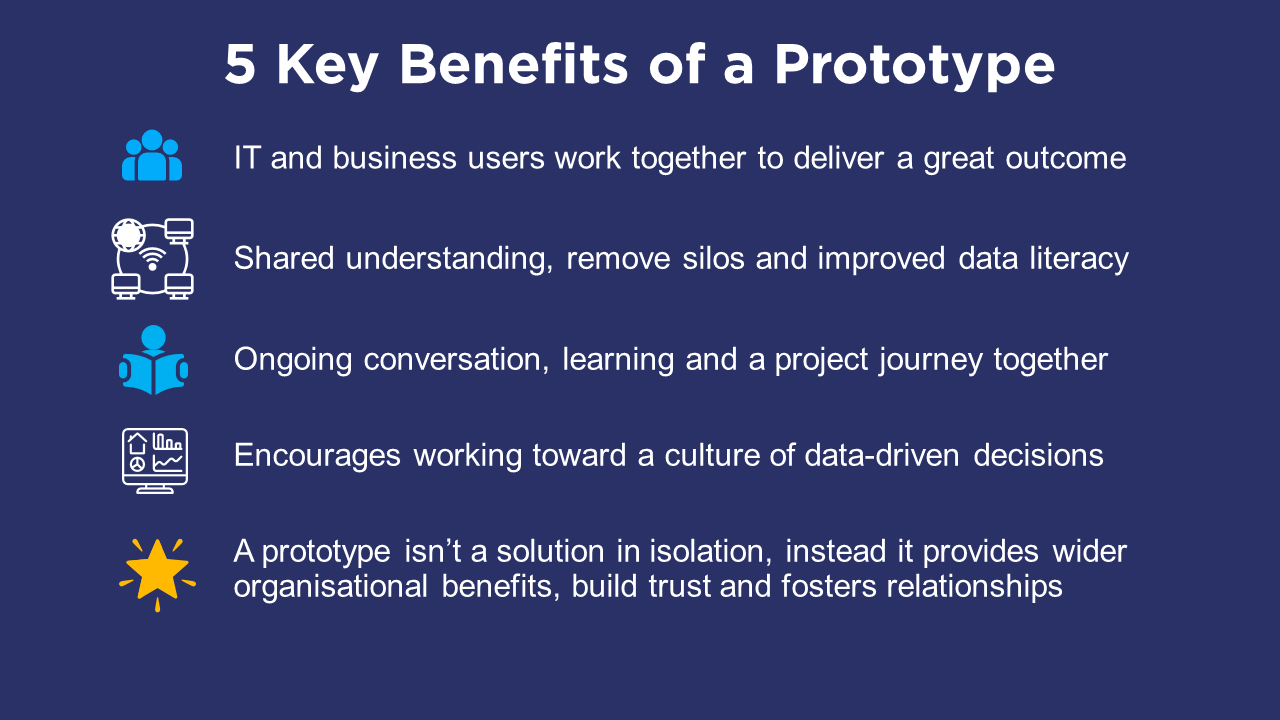
So by applying these 5 simple tips for developing a prototype at the start of your project, you can save a lot of potential pain later on. It is a step in answering the modern day challenge of how can you balance self service BI, and allows business users and data analysts to effectively communicate and work together.
Power BI Training Courses
We’re really excited to announce the DiscoverEI teams virtual 2-day Power BI training courses, to fast-track your Power BI journey. Click on the links below to learn more, or get in touch today!
Purchase Training


Do you want to learn how to design engaging and intuitive Power BI reports, which communicate your key insights at a glance and tell your data story?
Our two-day Power BI training course is designed specifically for Power BI Professionals and Data Analysts, and provides our best practice tips, tricks and hacks to help you transform your data! We provide this course online, in-person group sessions, or customised in-house training for your team. Places are limited (max 8 participants per class) so secure your spot today!