
Our Solutions
Working together with our clients, we apply the latest data analytics and visualisation tools to streamline environmental modelling and create a shared understanding of the complex environmental systems we are working to protect.
Environmental Analytics

Data at your fingertips
Applying the latest Business Intelligence tools within the environmental industry, we process, analyse and visualise your data through interactive dashboards and mobile apps to discover your data story. Our expertise includes: dashboard development and training (Power BI), custom visual development, and mobile apps.
Visual Solutions

See the big picture
Using video footage and computer animations, we enable you to better understand, visualise and communicate complex systems, and bring your environmental data to life. Our expertise includes: video capture by drones, environmental schematics, computer animations as well as developing virtual and mixed reality solutions.
Environmental Modelling
From simulations to solutions
We conceptualise, configure and simulate models of groundwater and surface water systems, working with you to develop solutions for your environmental challenges. Our expertise includes: water allocation modelling (eWater Source, REALM), groundwater modelling and calibration (MODFLOW, PEST), and environmental site assessments.
Environmental Analytics


Interactive Dashboards | Unleash your data
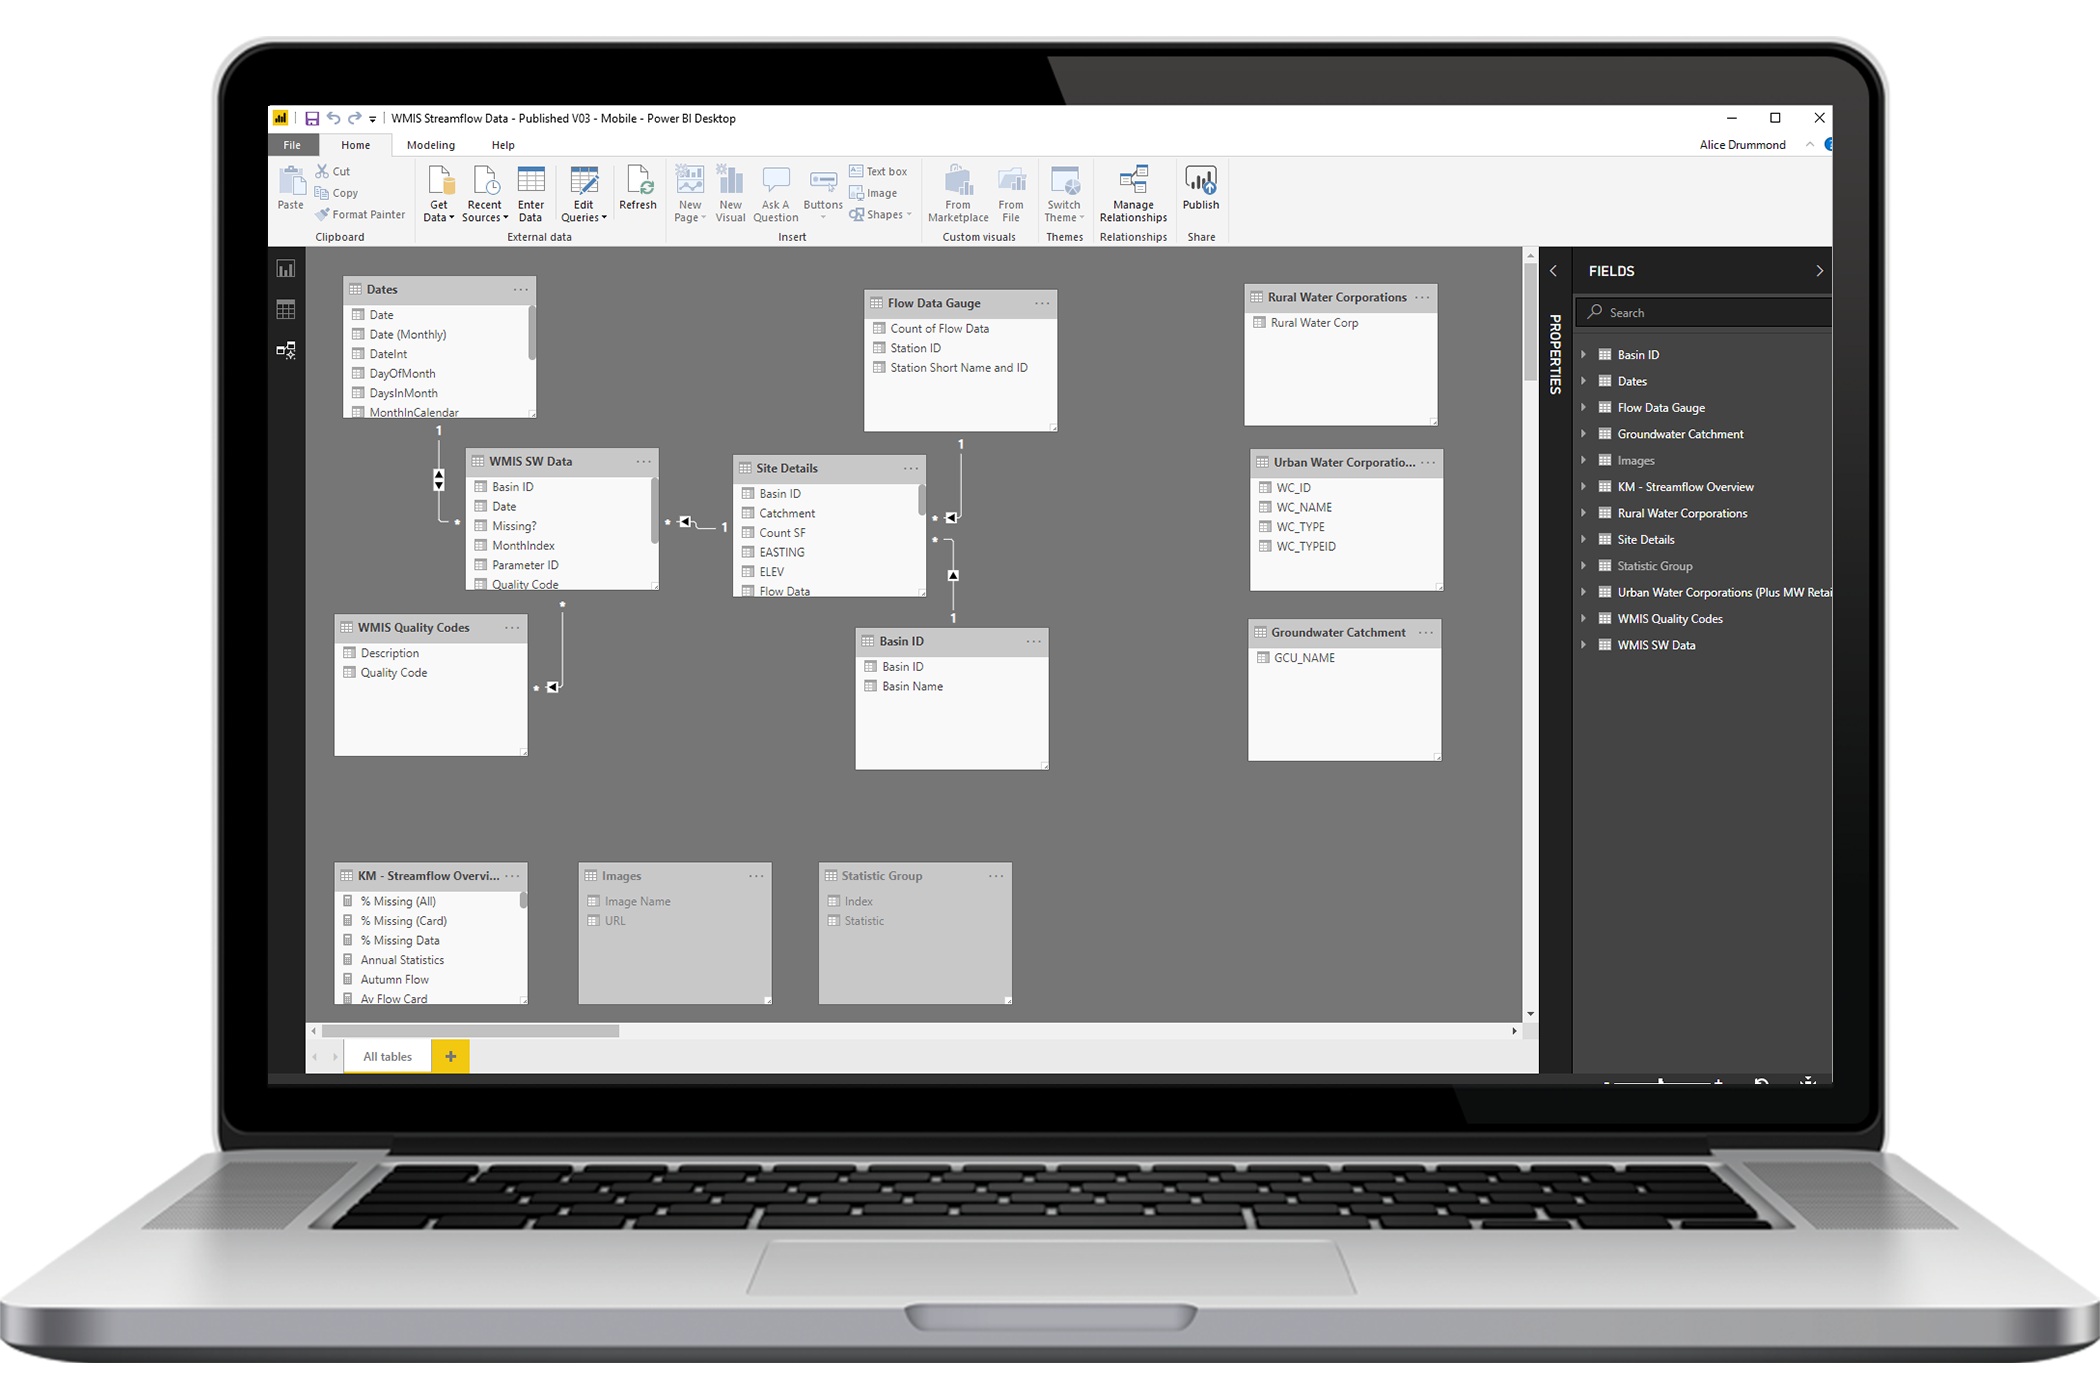
Let’s tell your data story. We transform lengthy reports into interactive dashboards and key insights, to help you convert environmental data into decisions. Using Power BI, we collate, process and analyse an entire projects worth of information, and create intuitive dashboards to unleash your data. And what’s more, we provide tailored training programs in Power BI using your own data, empowering our clients to maintain and update their dashboards in-house.
Our team of MS Associates in Business Intelligence, Environmental Analysts and industry partners are specialists in:
Data Modelling and Analysis: We transform entire projects into a centralised database, and process your data in a fraction of the time. Tasks that take days in Excel, can literally be performed in minutes using the powerful M and DAX languages inside of Power BI!
Interactive Dashboards: We create stunning visual reports and interactive dashboards using Power BI to help you analyse, identify and share key project insights. We use best practice techniques such as bookmarks, Q&A and tooltips to create intuitive dashboards focused on providing a seamless user experience.
Data on demand: We create Apps within the Power BI cloud service, allowing project teams to collaborate on their dashboards - no matter where they are. We embed real-time data from environmental field sensors into your dashboards, and configure mobile alerts to notify you when your data exceeds its predefined limits.
Tailored Training: We provide customised training programs to teach you how to maintain and update your own Power BI models in-house. Learn the fundamentals of dashboard design from our Microsoft Associate in Business Intelligence and Environmental Engineer: Alice Drummond, and feel supported every step of the way.
Custom Visuals | Your data, your way
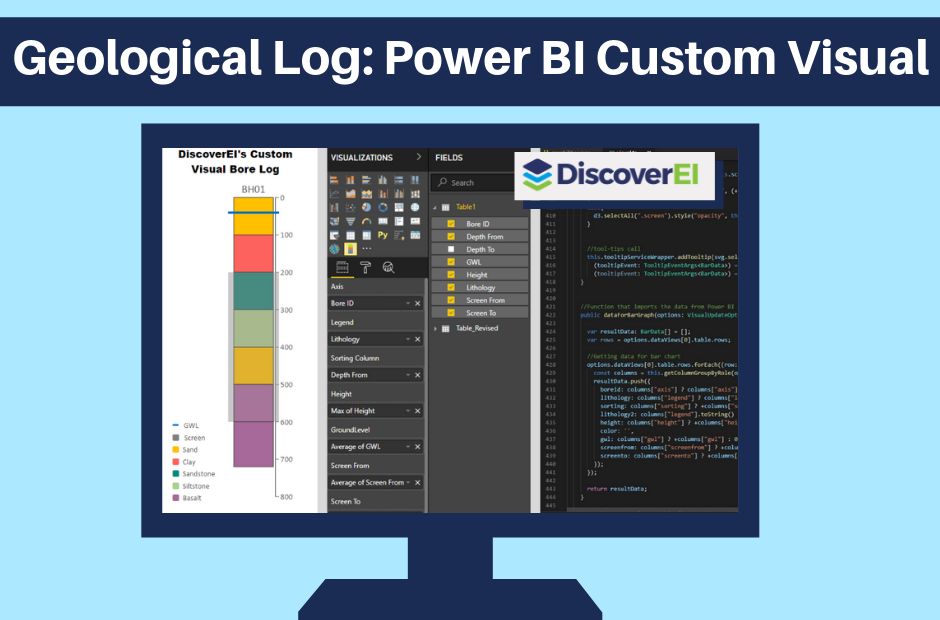
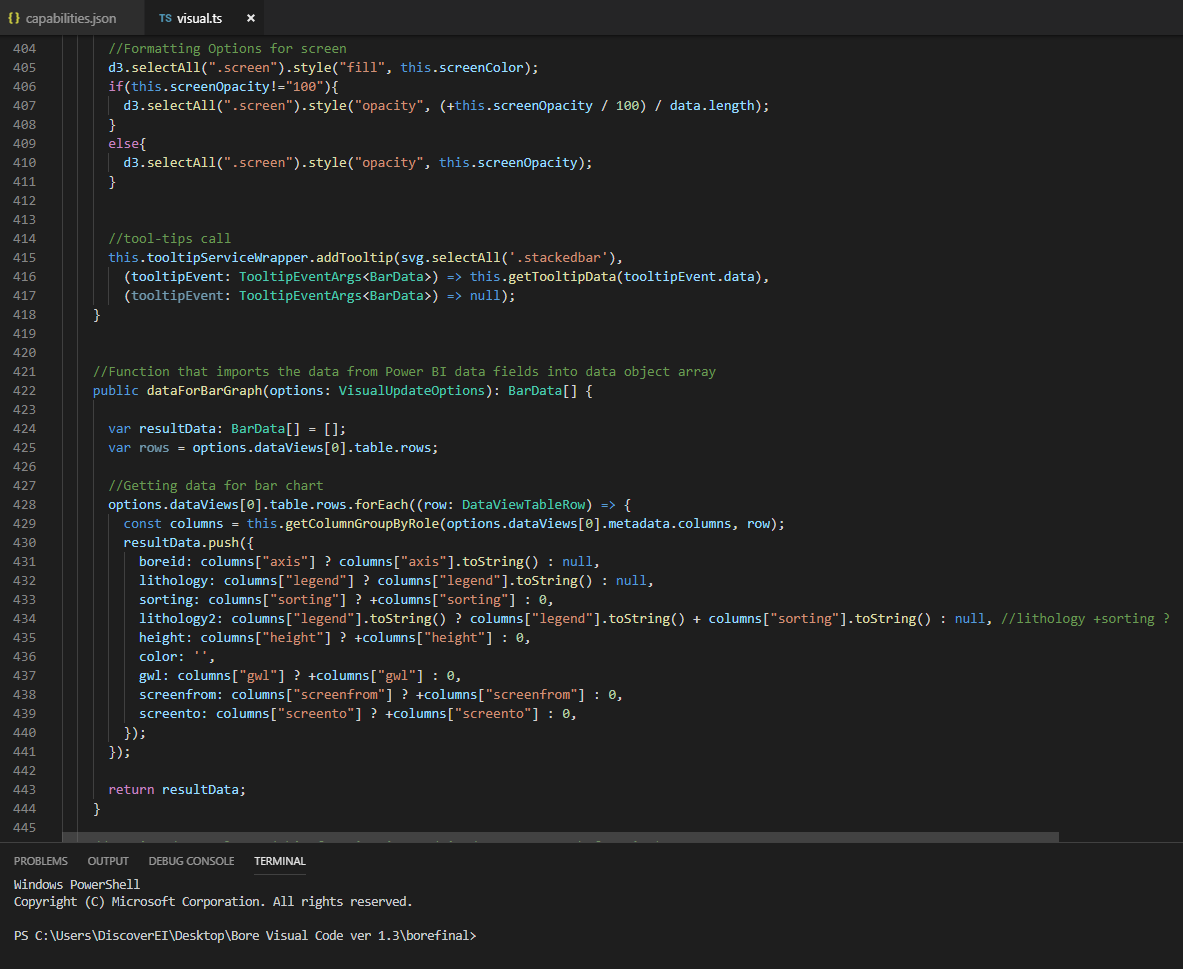
Sometimes you need to stand out from the crowd. We create custom visuals for those times when you need your data visualised differently. Whether it’s displaying subsurface geology, detailed time-series information or statistical relationships, we develop unique visuals to meet your needs.
Our team of MS Associates, software developers and industry partners are specialists in:
Power BI Custom Visual Development: We develop interactive, user friendly custom visuals (engineered in Typescript) for your unique environmental systems, and embed these visuals inside of your Power BI and MS Excel models to tell your data story. This option is perfect for providing a no-code solutions for every day dashboard users across your entire organisation.
R and Python Visuals for Power BI: We develop fit-for-purpose visuals to embed inside of your Power BI models using R and Python languages, designed to meet your specific project needs. This option provides a quick and low-cost solution for scenarios where you require unique visuals on smaller, once-off projects.
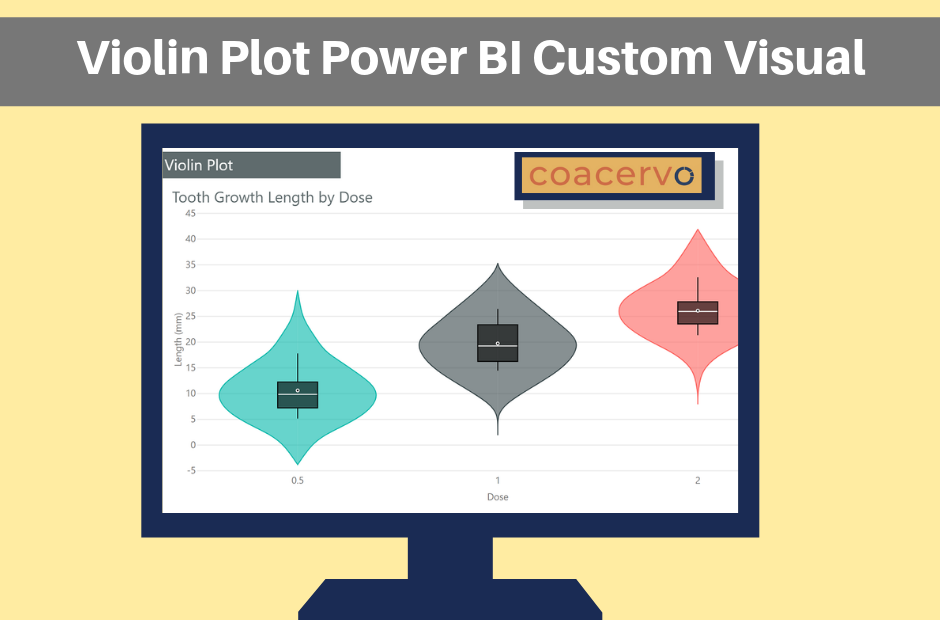
Custom Visuals for the Marketplace: We create Power BI custom visuals for public access on Microsoft AppSource, so our clients can share their unique visuals with the global community and promote their innovative brand. Our industry partner Daniel Marsh-Patrick (Founder of Coacervo) has recently published several Power BI custom visuals to the market place (check out his Violin Plot and Small Multiples Line Chart).


Mobile Apps | Data at your fingertips
Access your data on the go. We create customised mobile applications tailored to your individual project needs. Our low-code solutions offer an affordable alternative to full-scale mobile application development, and automatically syncs across your Microsoft Platforms for seamless integration.
Our team of MS Associates, software developers and industry partners are specialists in:
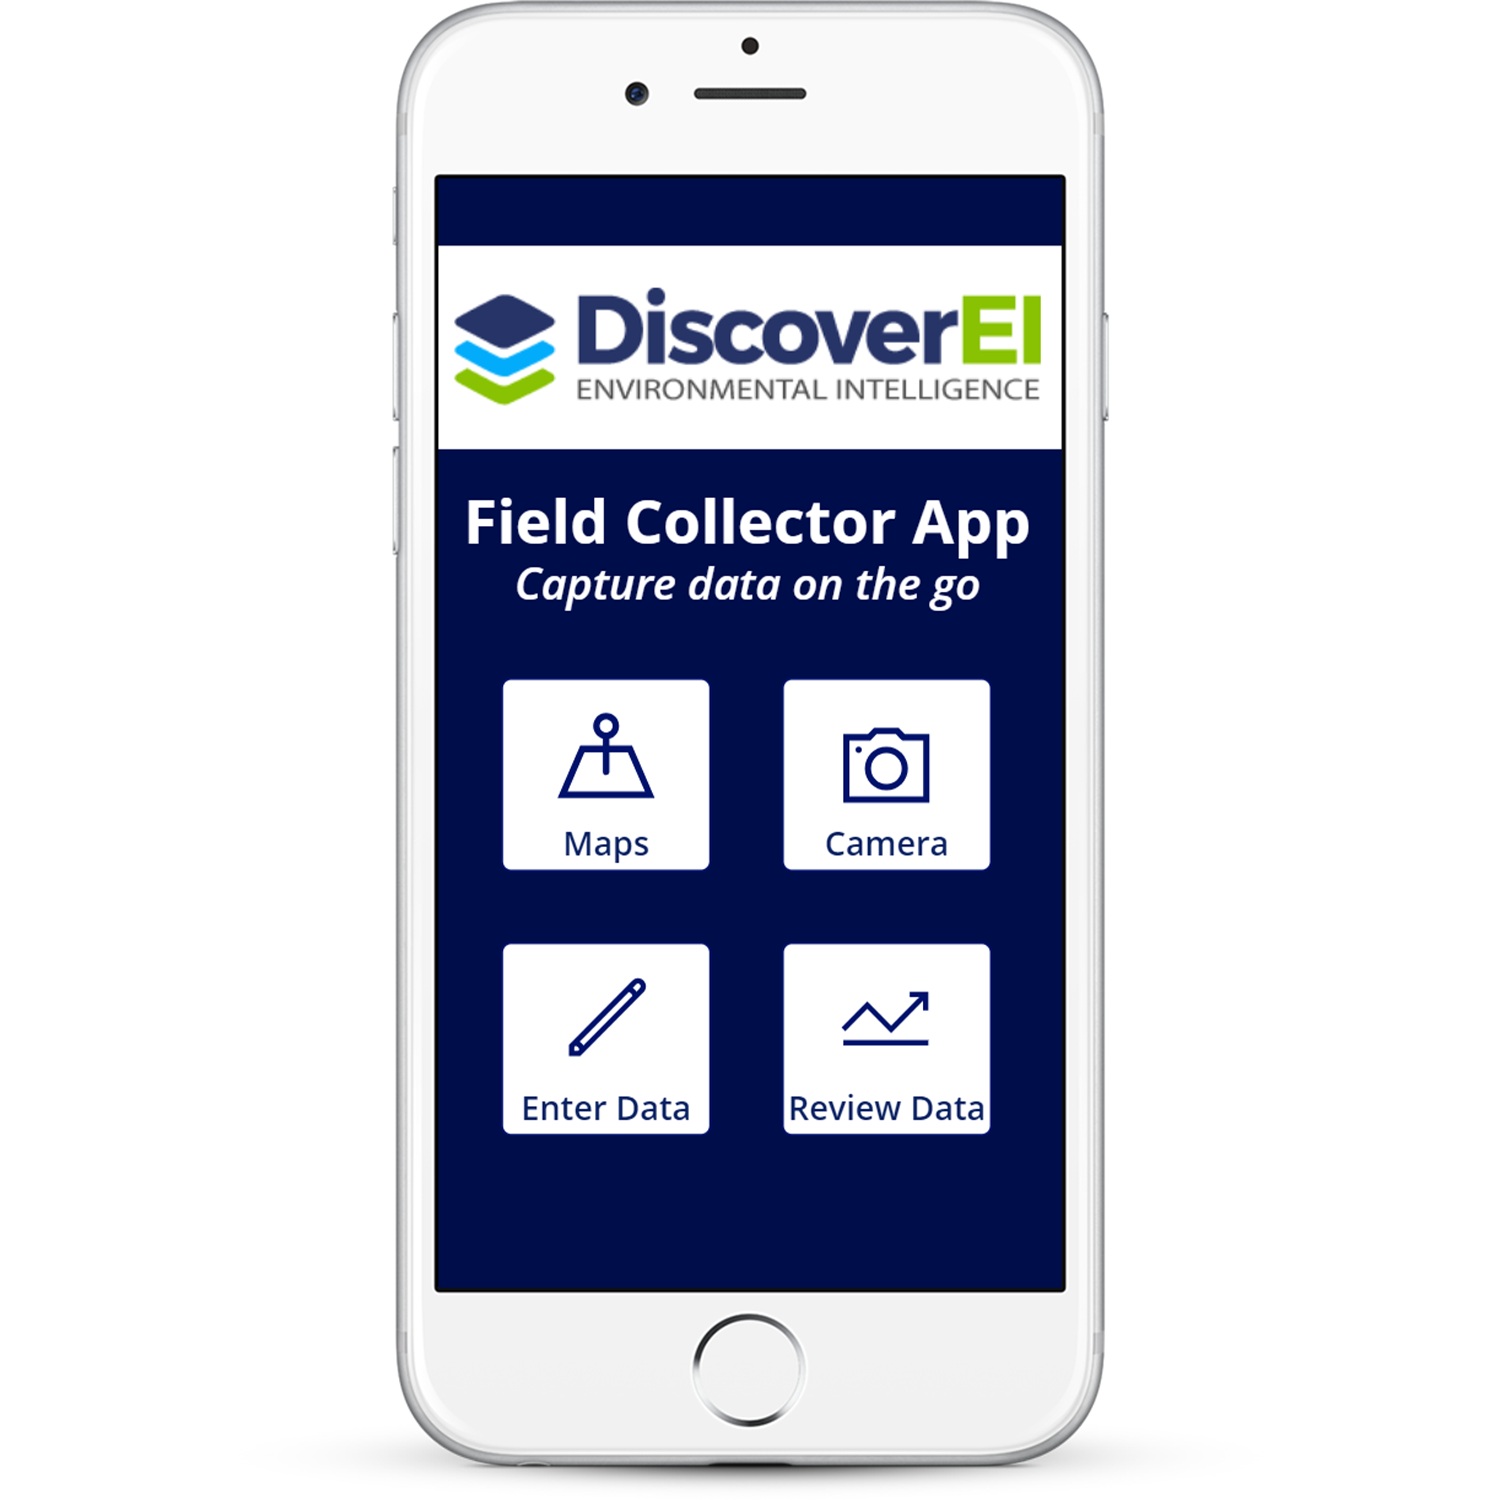
Custom Mobile App Development: We create customised mobile applications to meet your unique project needs. Whether it’s collecting environmental field data, managing project teams, or accessing information on the go, we work with you to develop flexible low-code mobile applications to fit even the smallest project budget.
Mobile App Integration: We close the loop by fully integrating our mobile applications into your organisation. We avoid double handling of information by creating live connections between our mobile apps and your existing Microsoft platforms (OneDrive, SharePoint, Outlook, Excel, Power BI) to streamline data processing and automate tasks.
Power BI Mobile Applications: We place data at your fingertips by configuring your Power BI dashboards and reports for mobile apps. Now you can easily access your data anywhere, anytime.
Case Studies
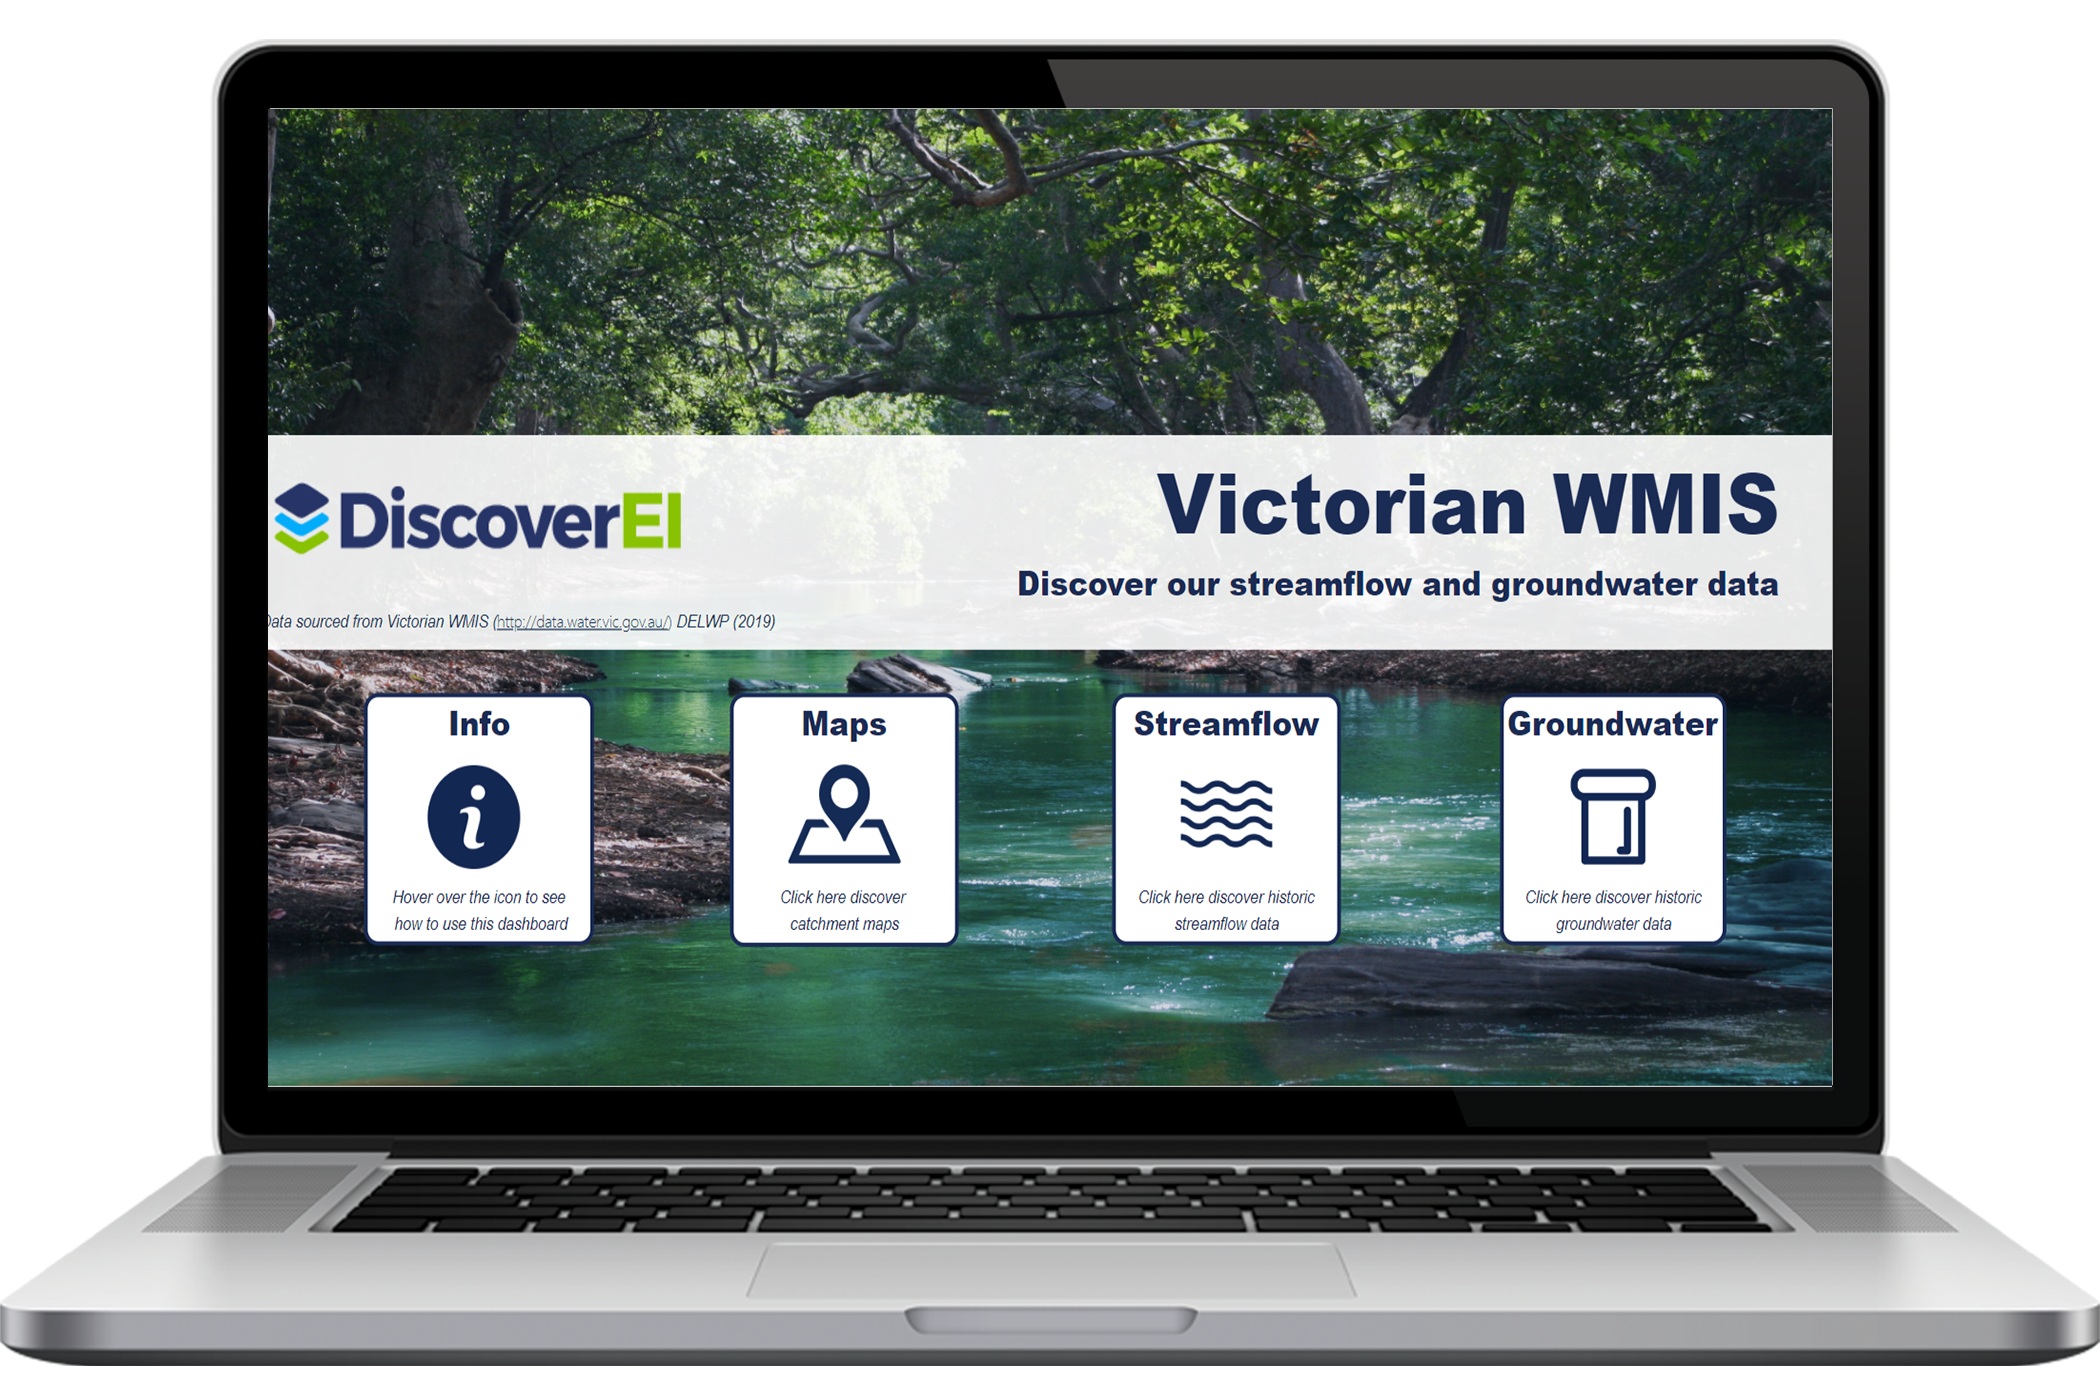
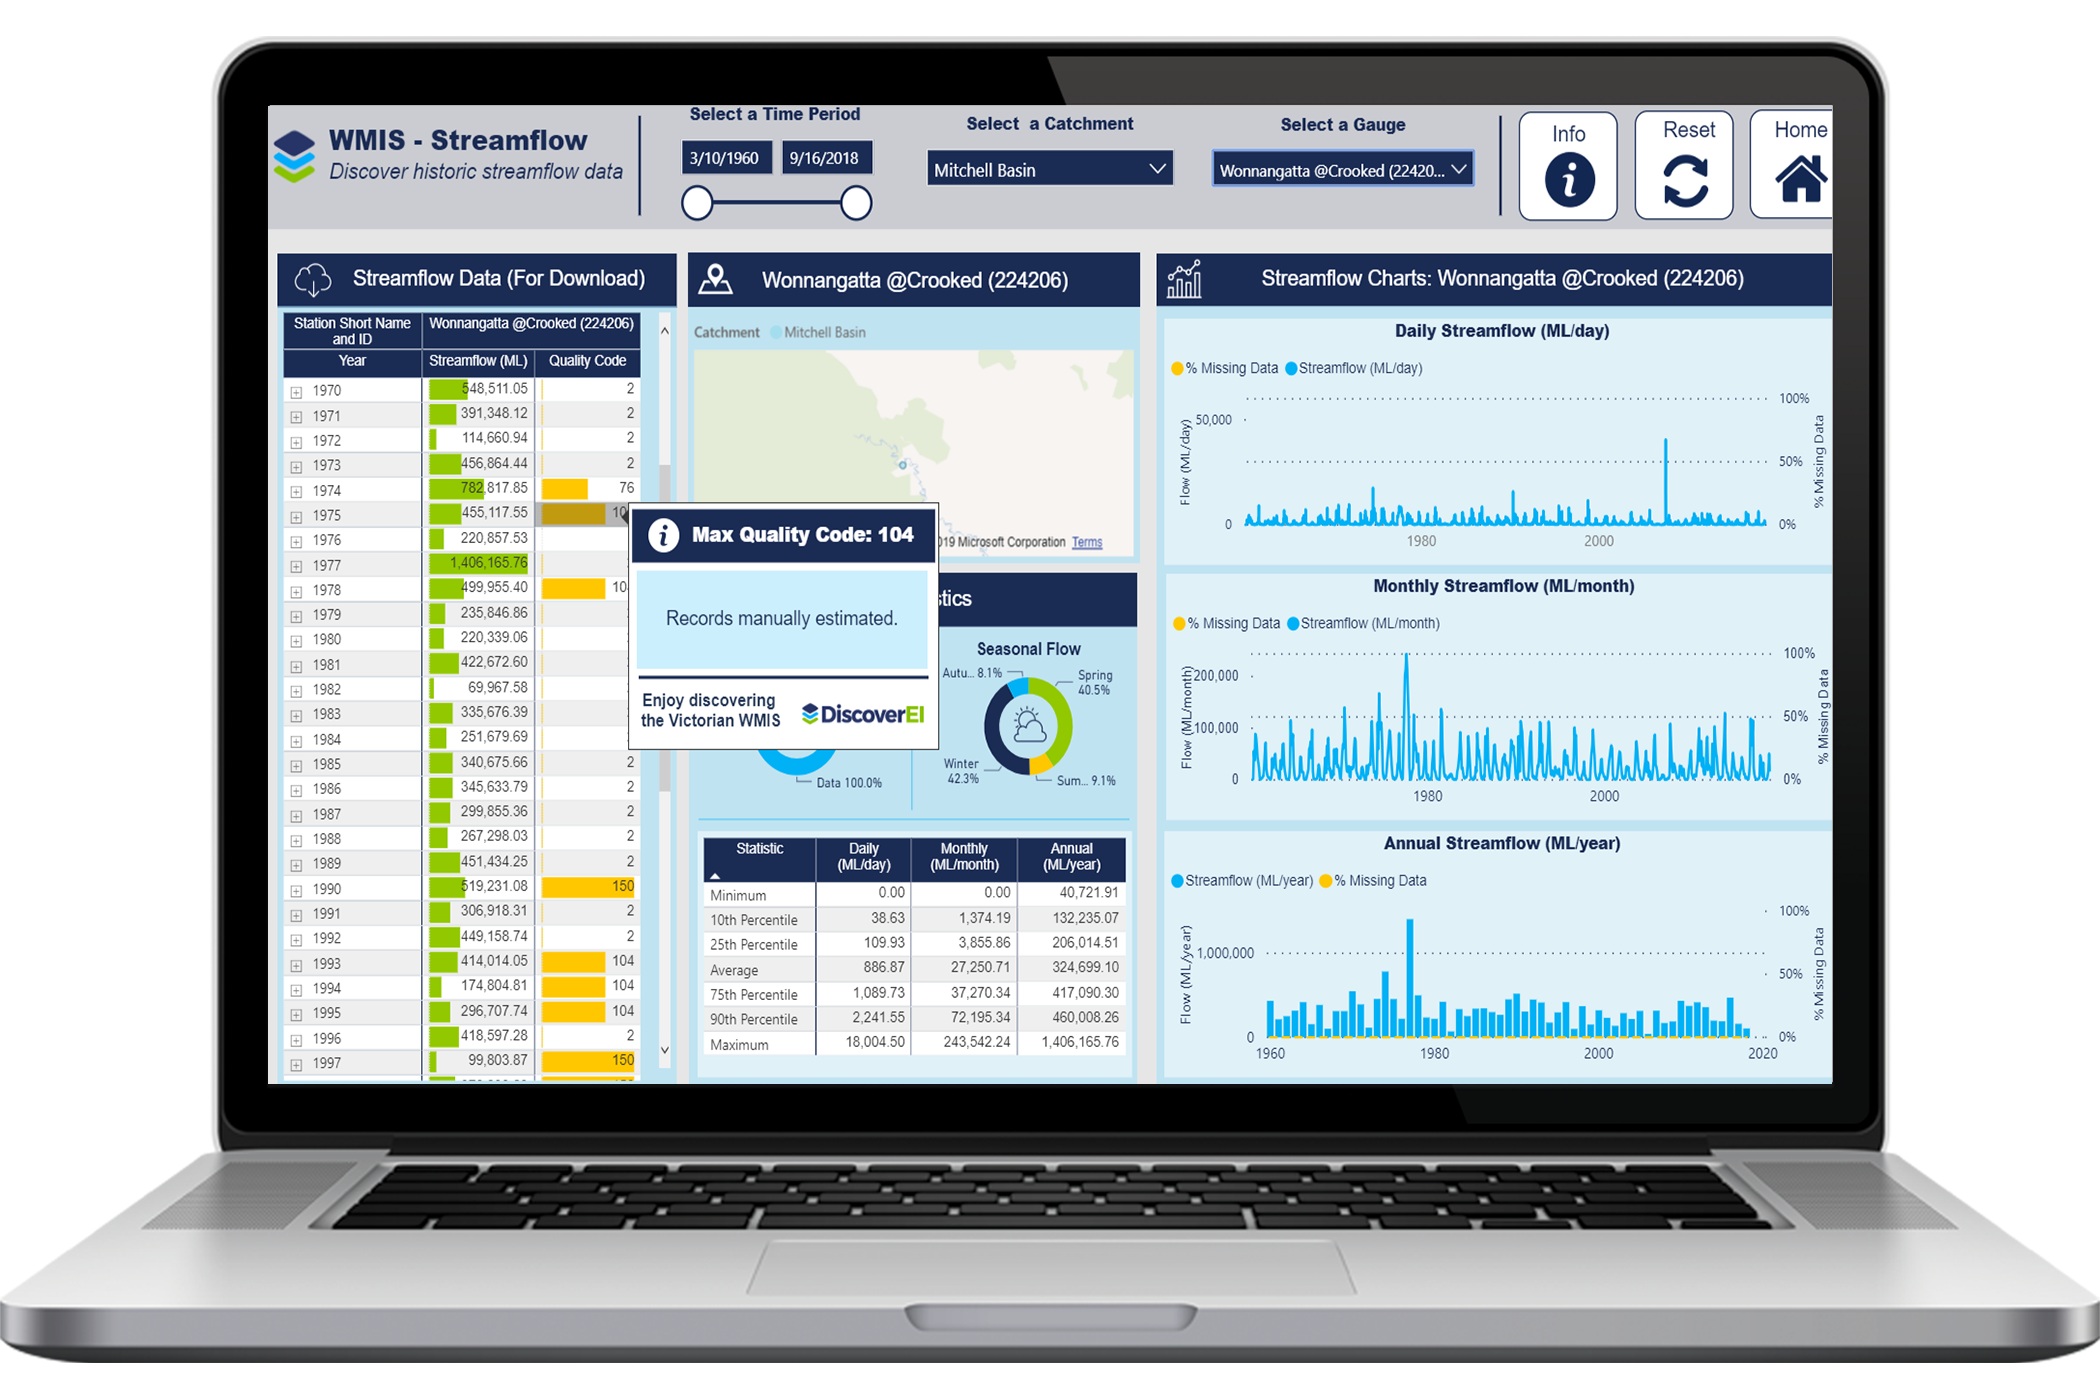
Discover Dashboards
We apply the latest Business Intelligence tools within the environmental industry to process, analyse and visualise your environmental data through interactive dashboards and mobile apps to tell your data story.
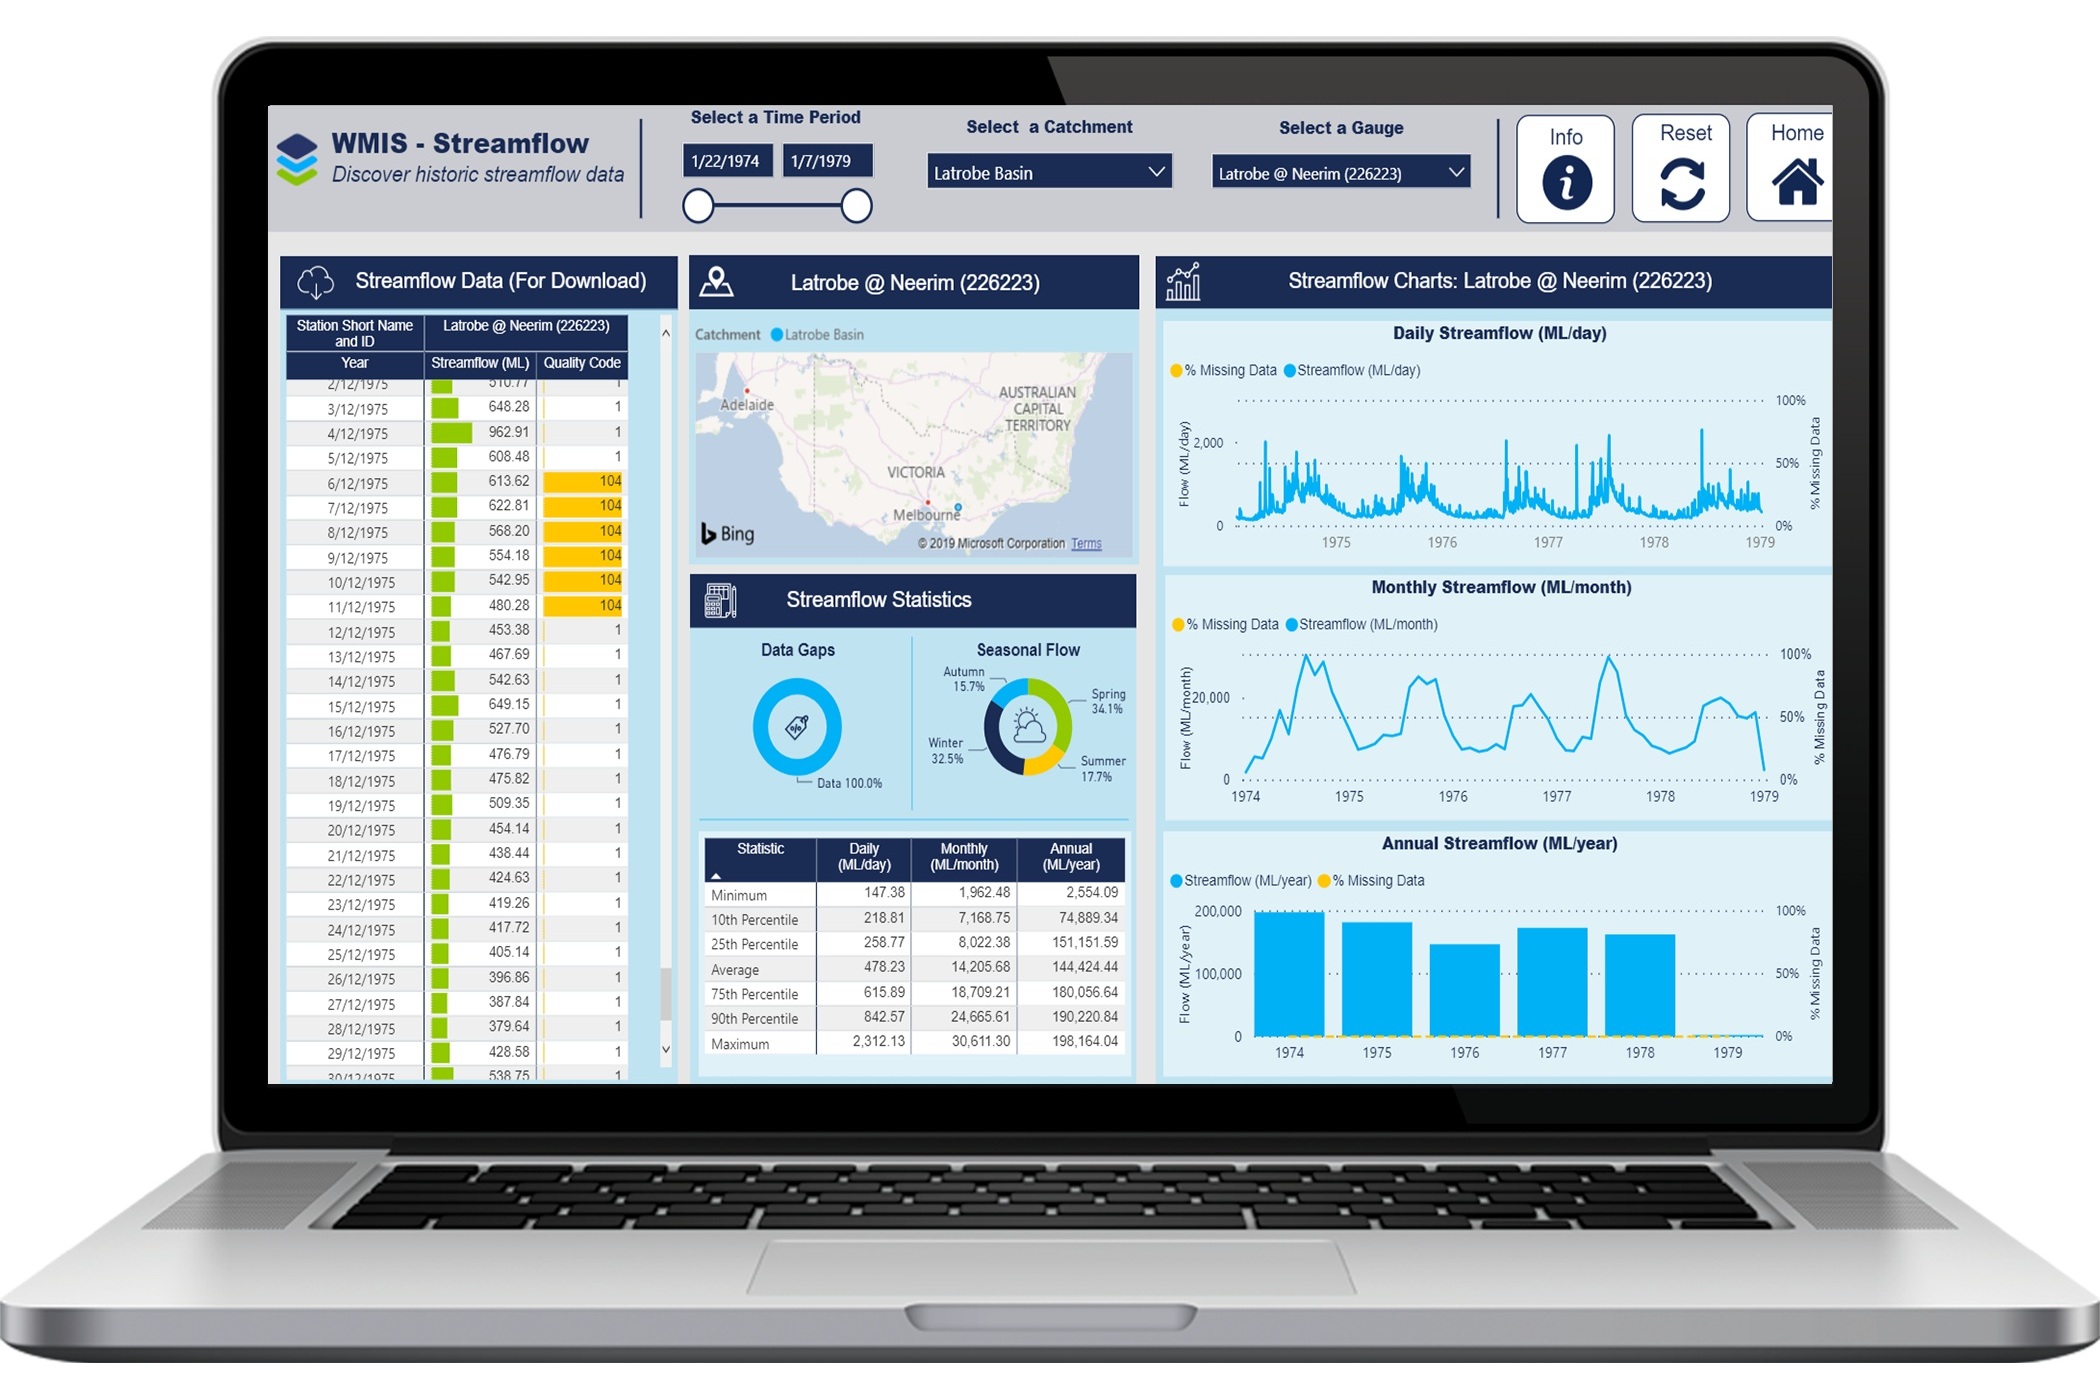
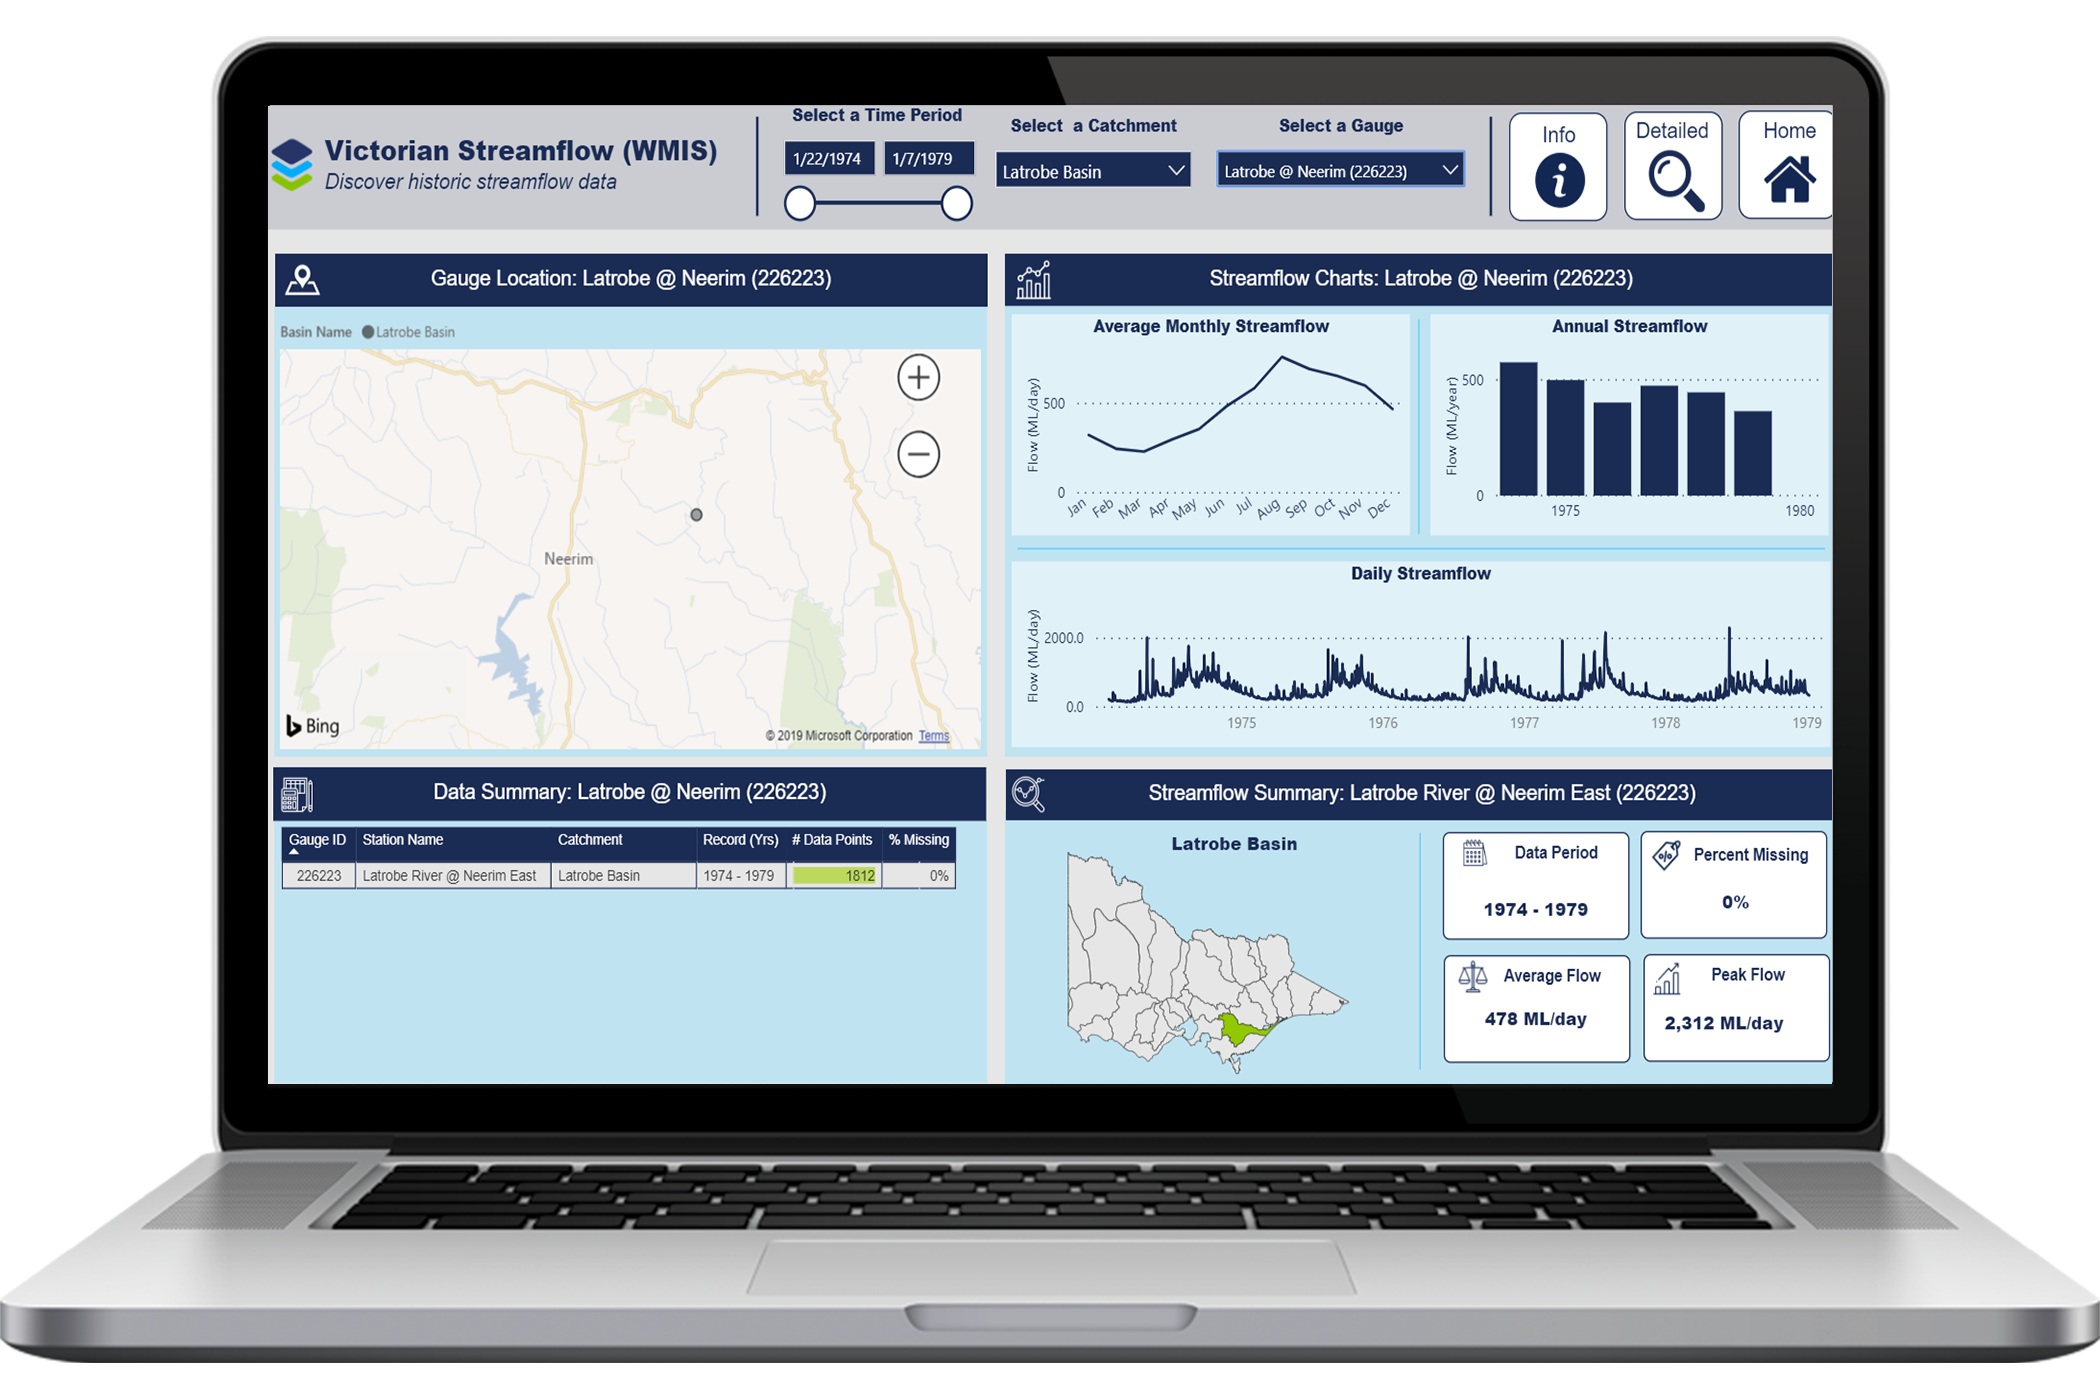
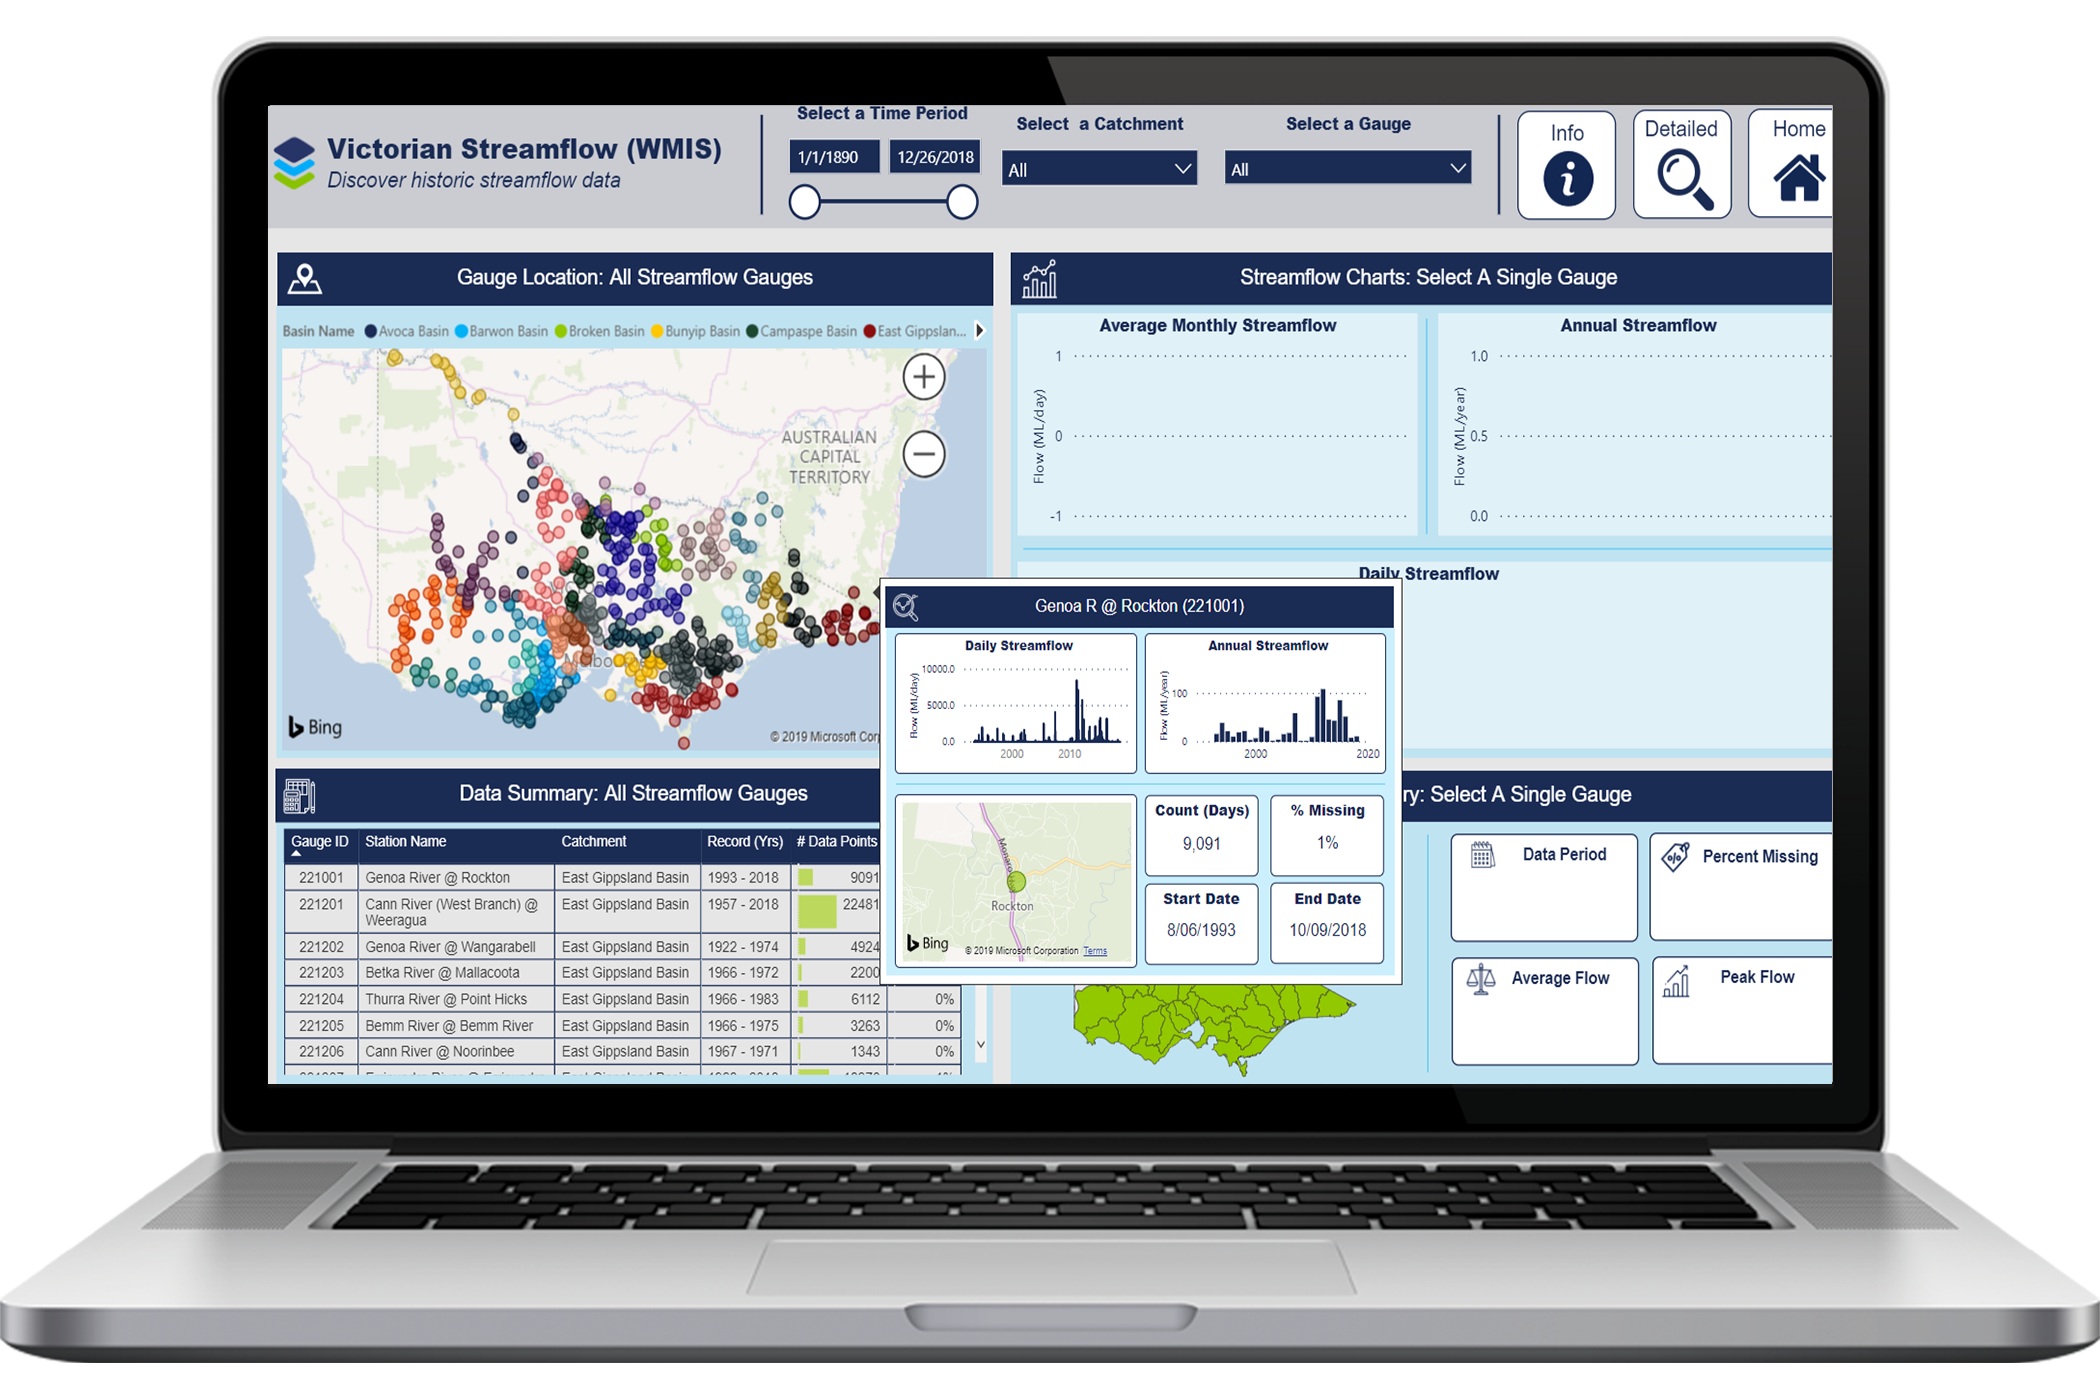
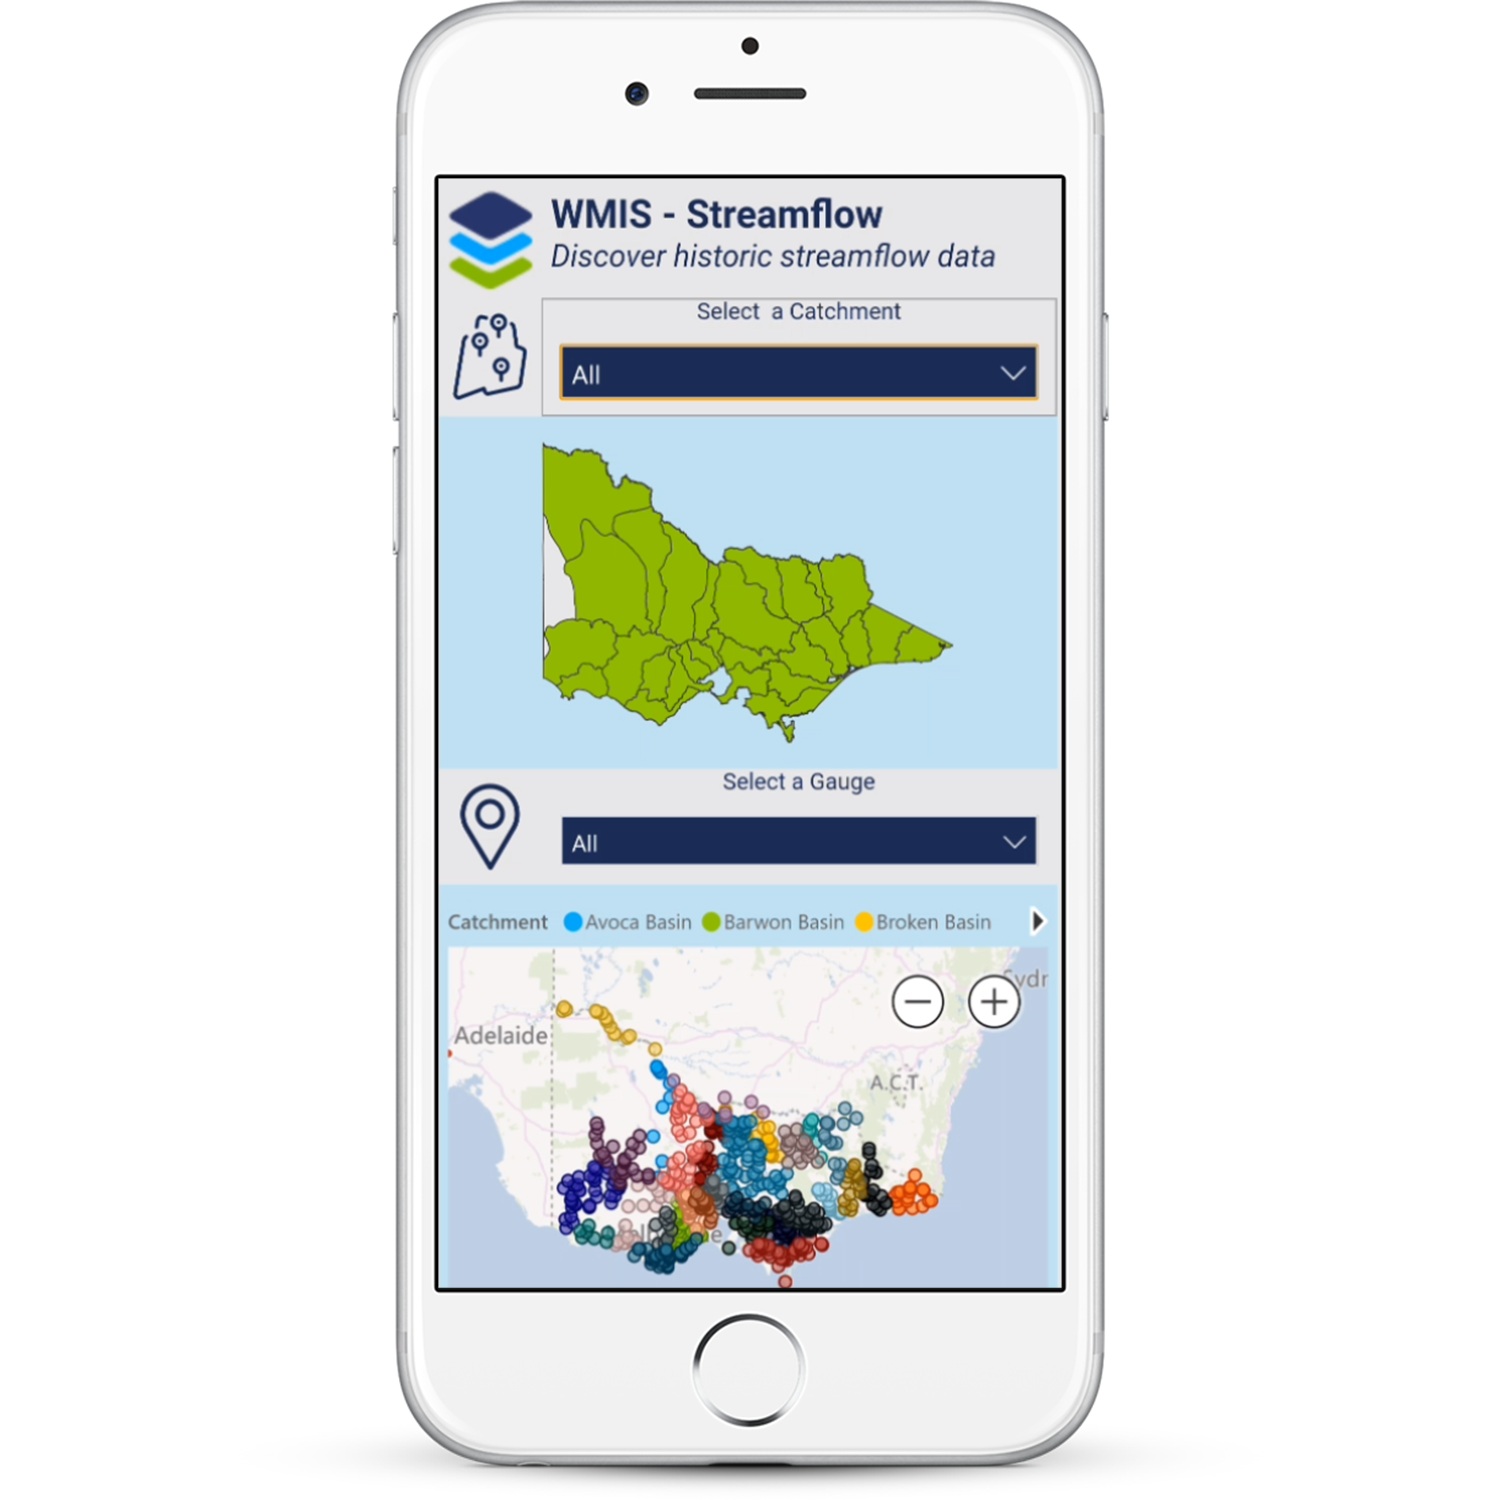
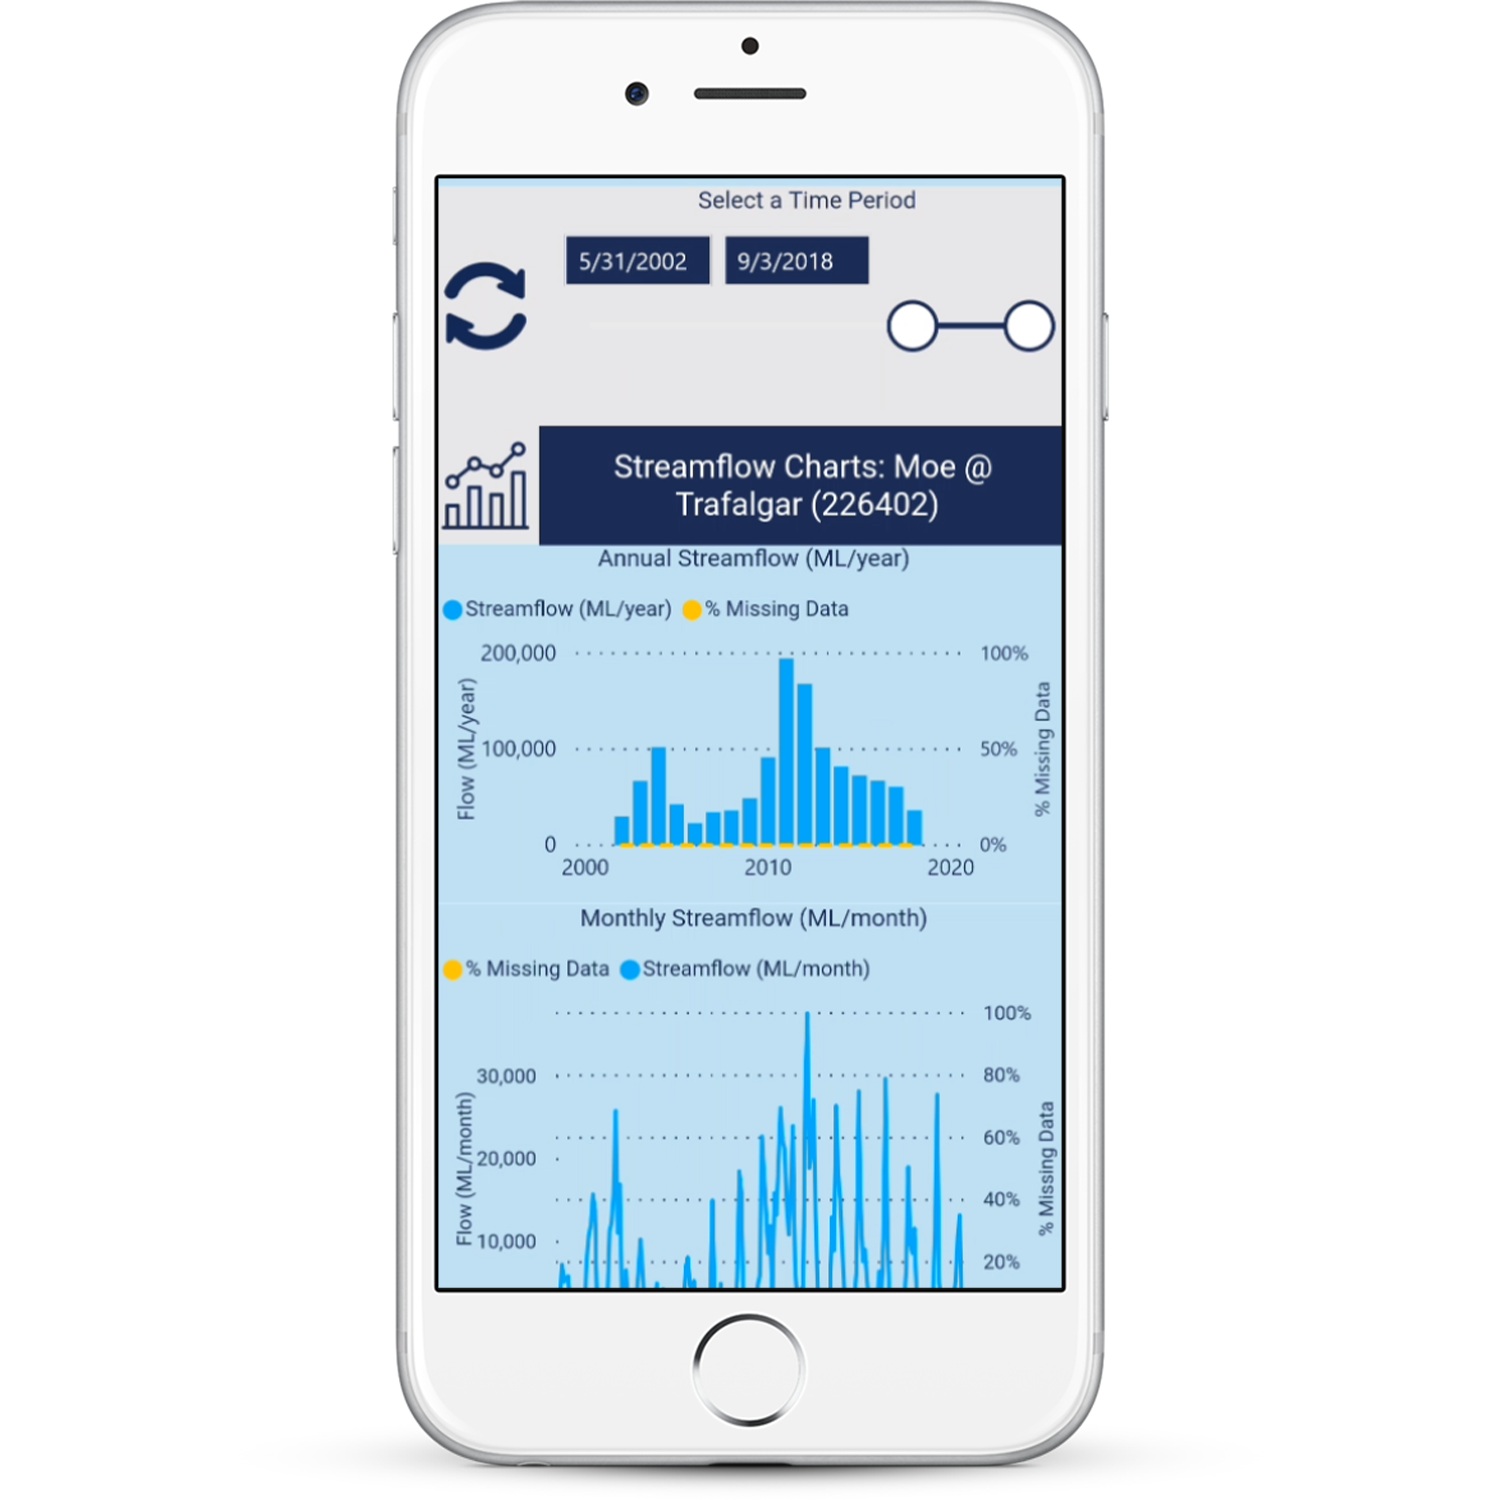
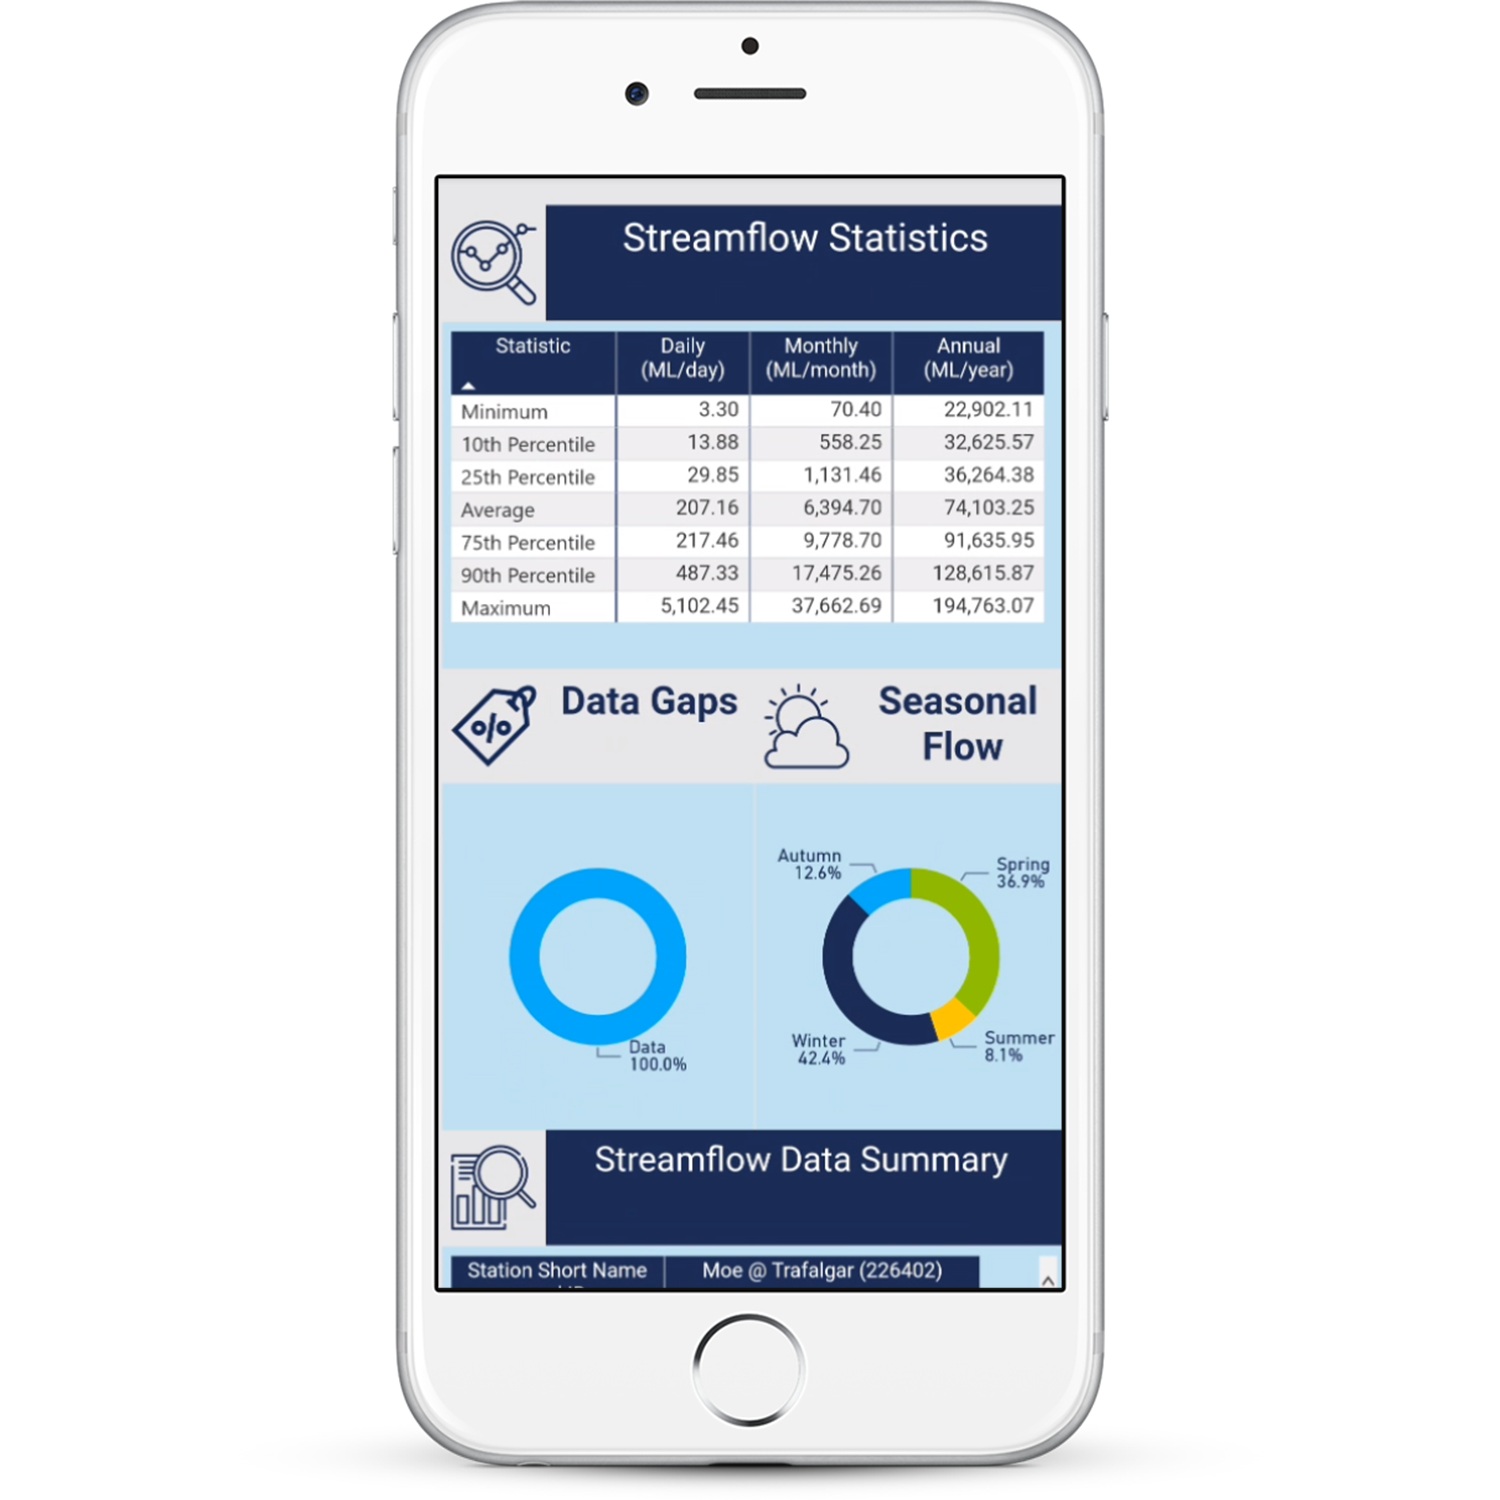
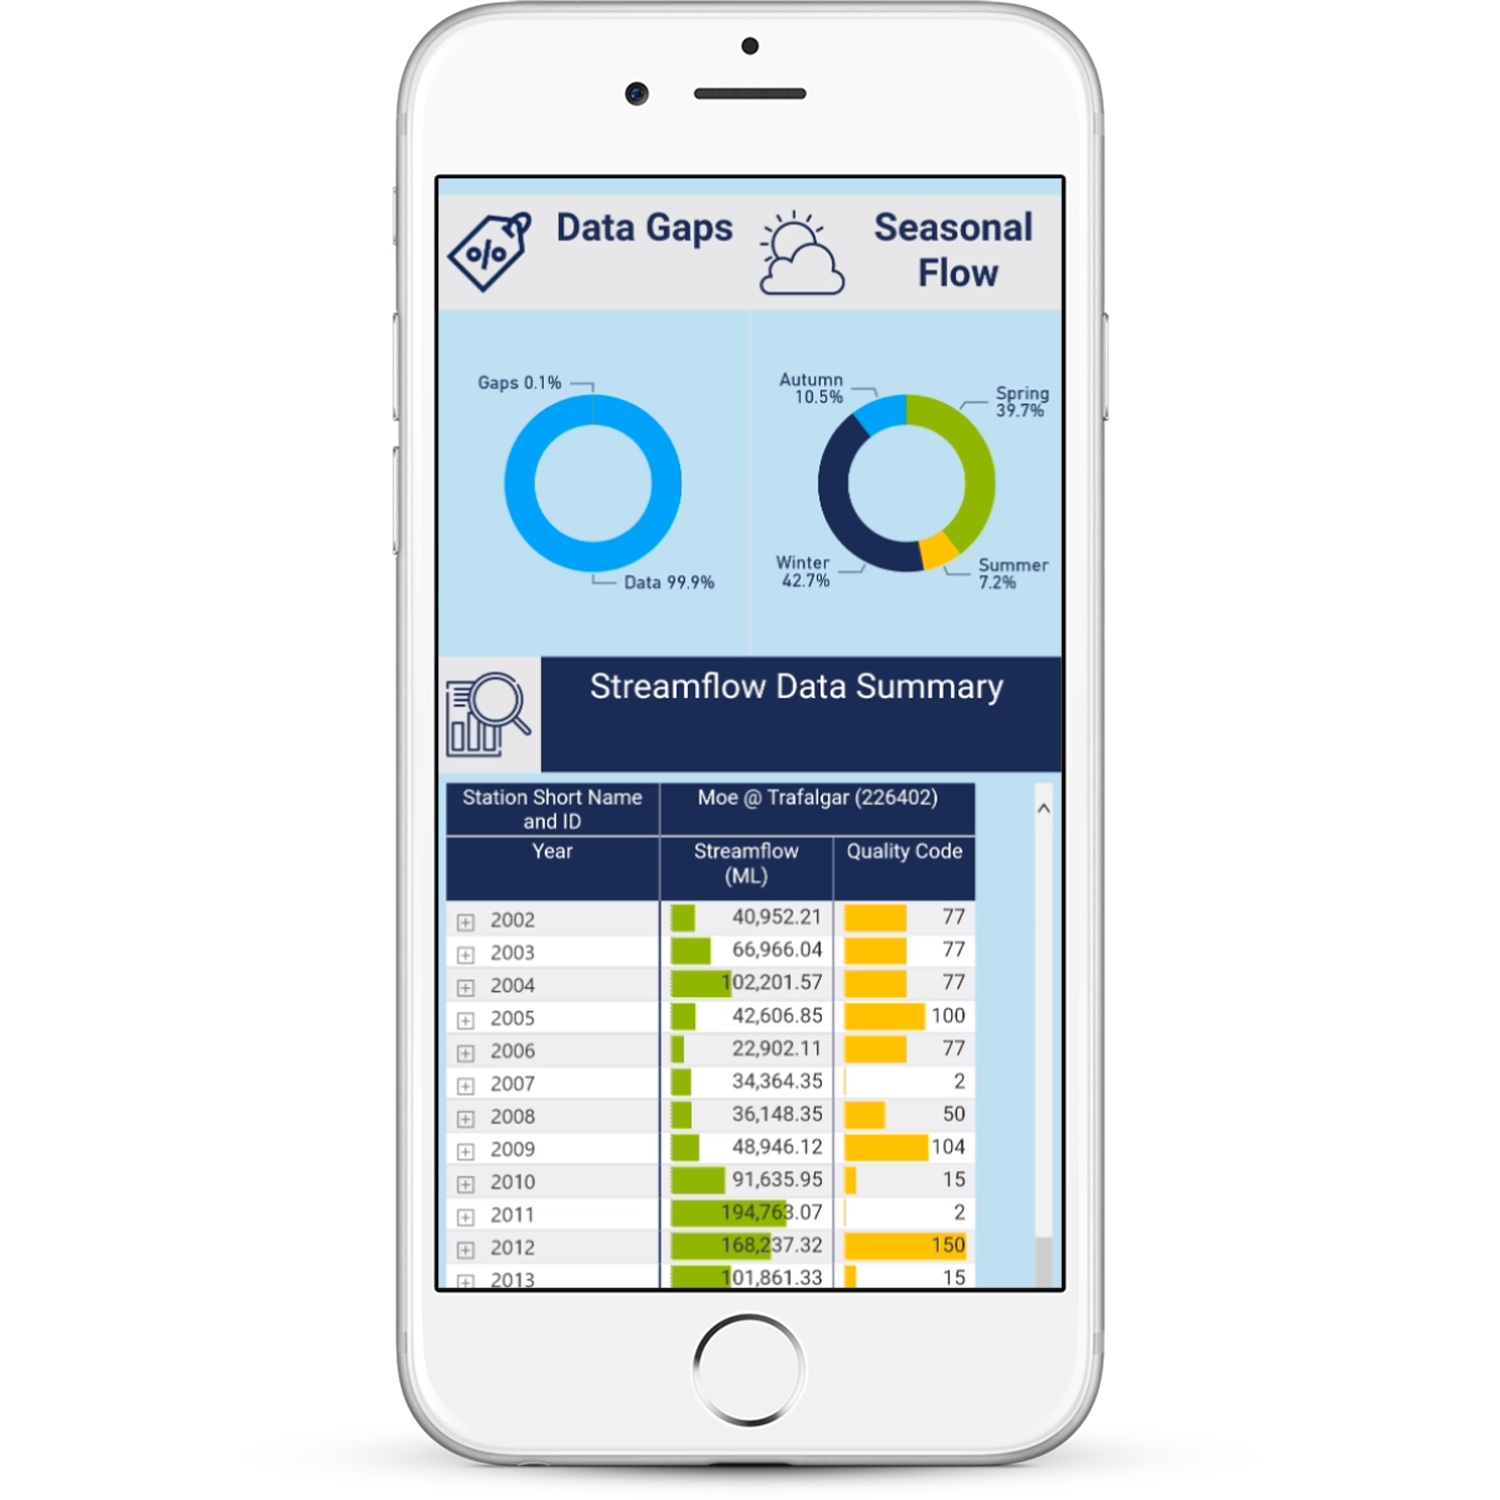
Check out this short video where we showcase how we can easily extract data insights from over 7,000,000 rows of historical streamflow data from the Victorian Water Management Information System (DELWP, 2019) which can help water authorities manage our future water resources.

Discover Mobile Apps
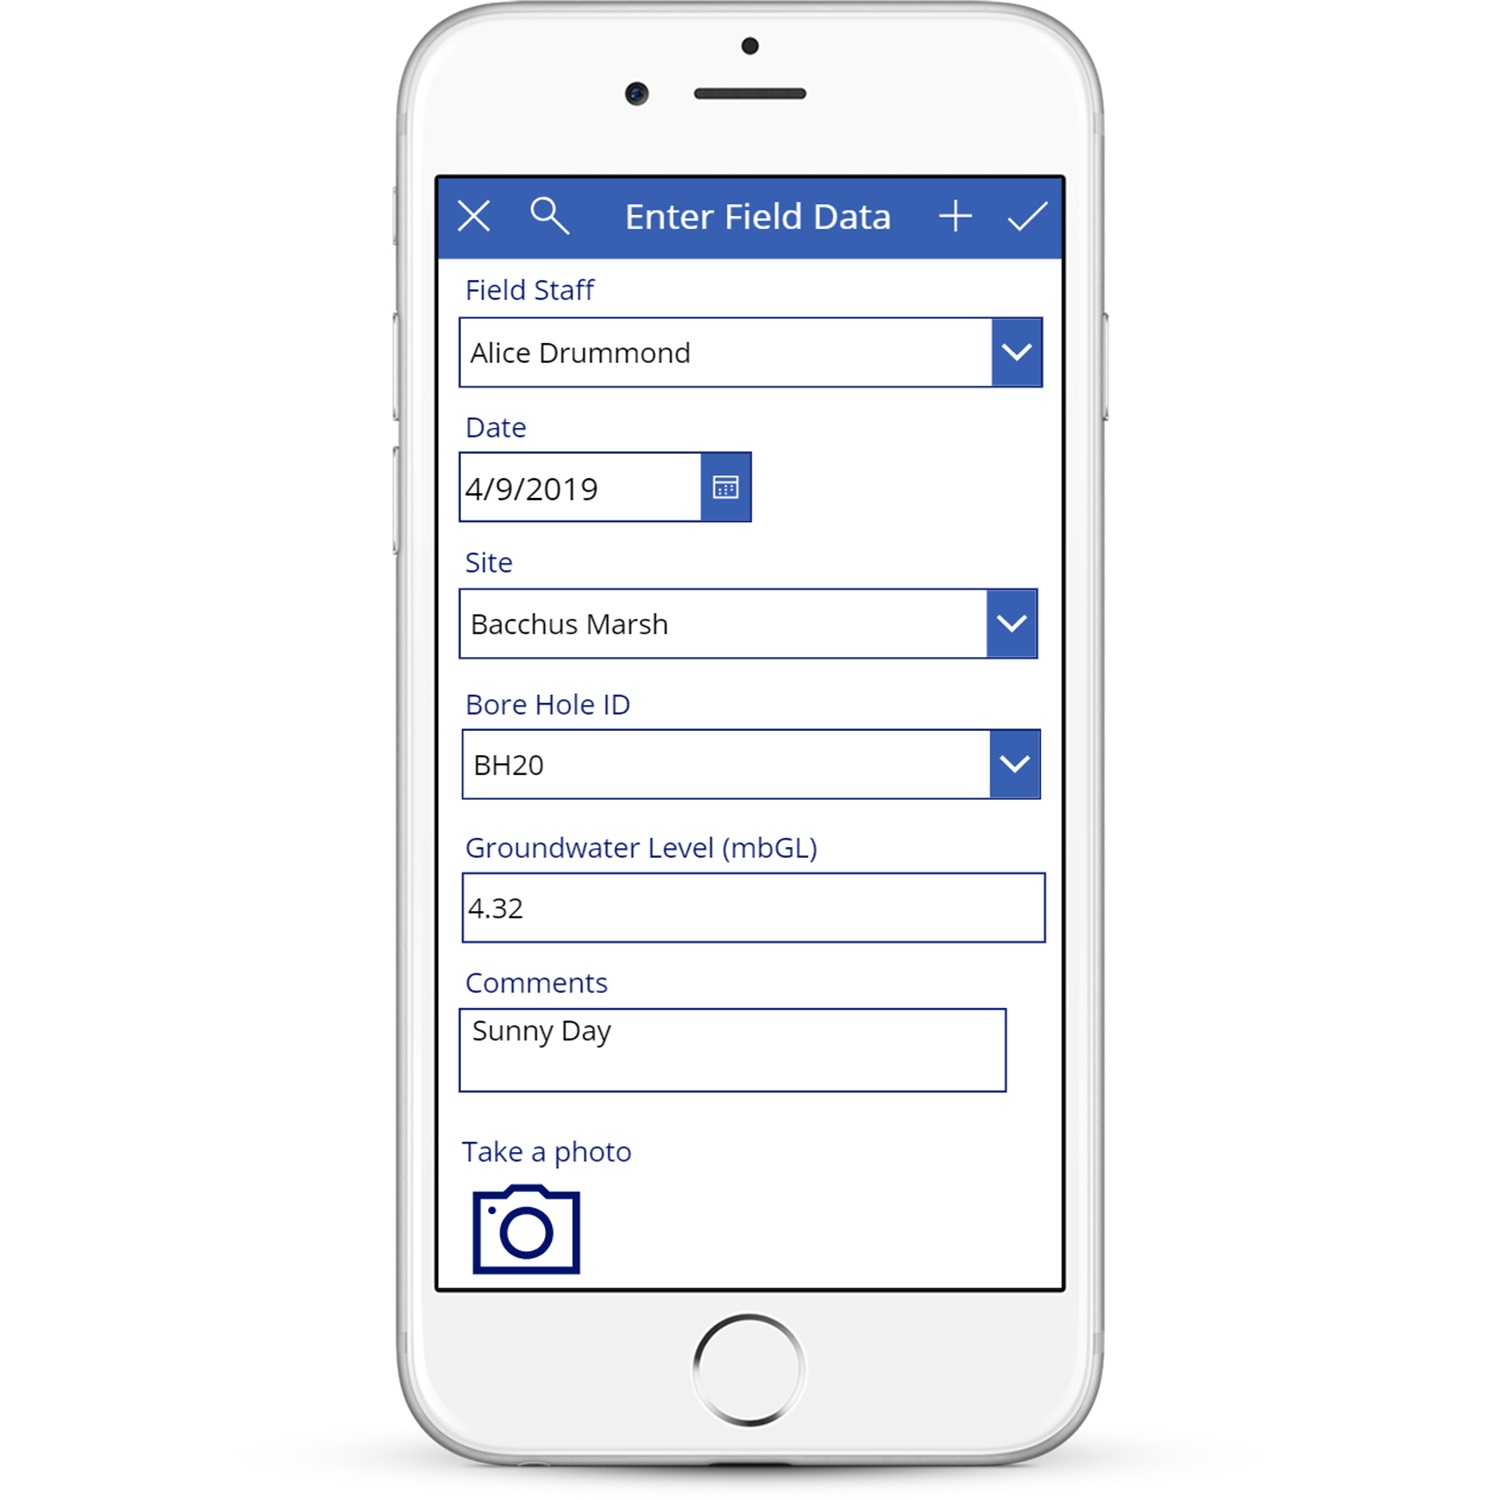
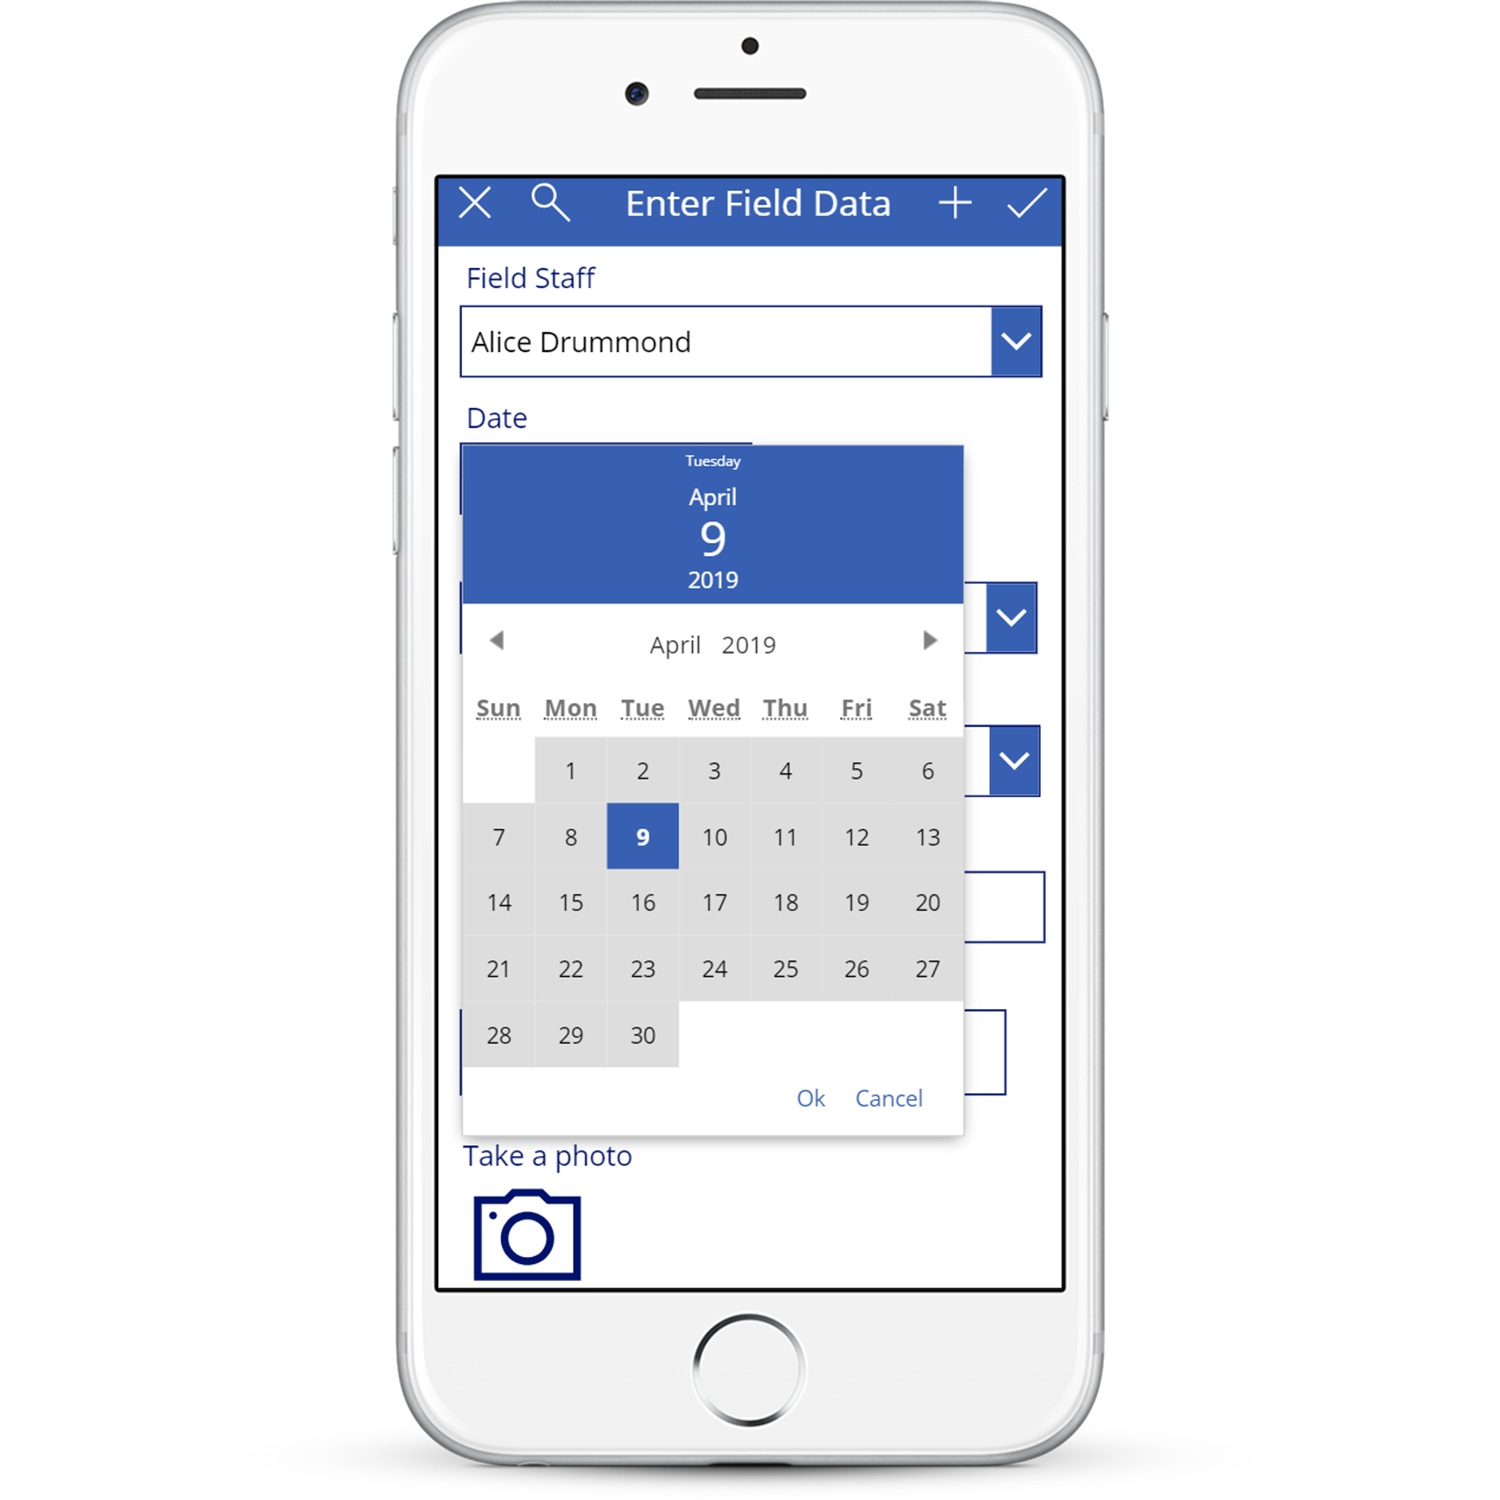
Access your data on the go. We create custom mobile apps tailored to meet our clients unique project needs. Whether it’s collecting environmental field data, managing project teams, or accessing information on the go, we work with our clients to develop flexible low-code mobile applications to fit even the smallest project budget!
Check out this example of an environmental field data collection app which DiscoverEI created to help environmental field staff to enter data on the go, and automatically syncs to your systems back in the office to avoid double handling data.

Mobile Dashboards
Discover how we combine the latest Business Intelligence tools with mobile apps within the environmental industry so that you can access your data anywhere, anytime. Whether it’s access to real-time data from environmental field sensors or configuring mobile alerts to notify you when your data exceeds predefined limits, the possibilities are endless.
Check out this example of how DiscoverEI configured a mobile app which can help water authorities and environmental managers access over 7,000,000 rows of historical streamflow data from the Victorian Water Management Information System (DELWP, 2019) in the palm of their hands!

Visualisations


Drones and VR | Reality rediscovered
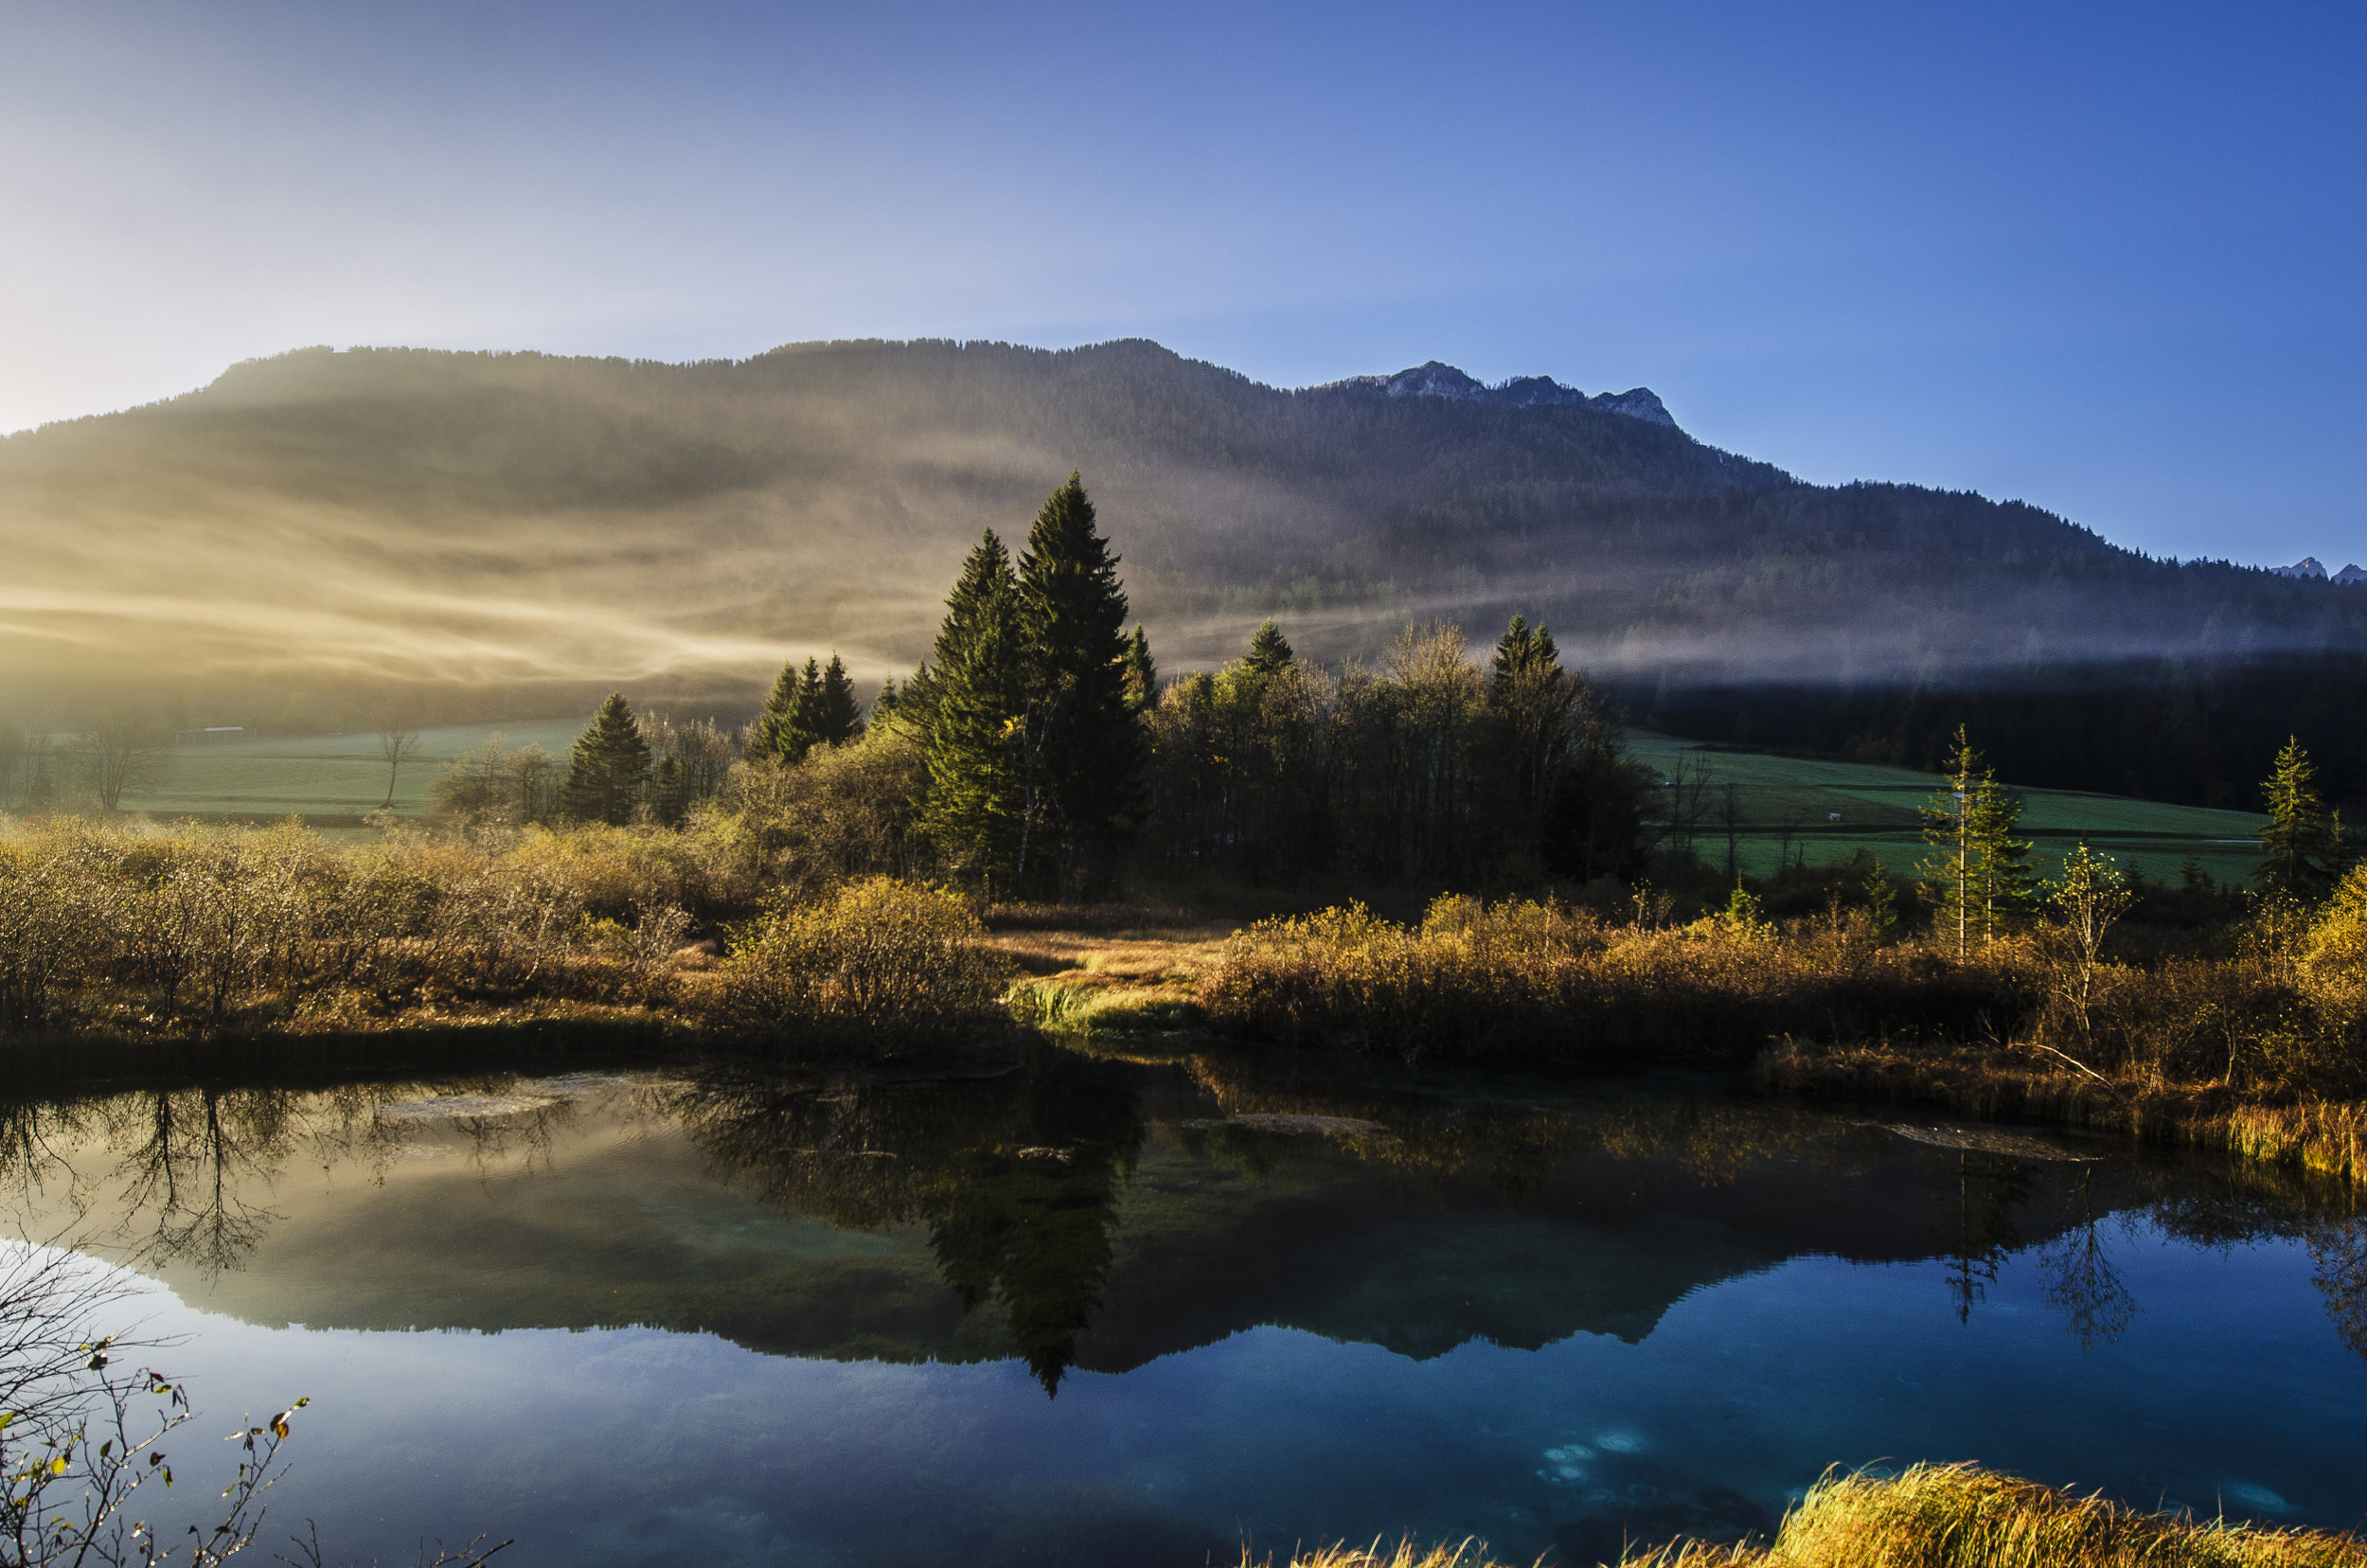
Immerse yourself in the environment. We use drone technology and virtual reality to help create new connections and a shared understanding to the environmental systems we are working to protect.
Our registered drone operators and team of industry partners are specialists in:
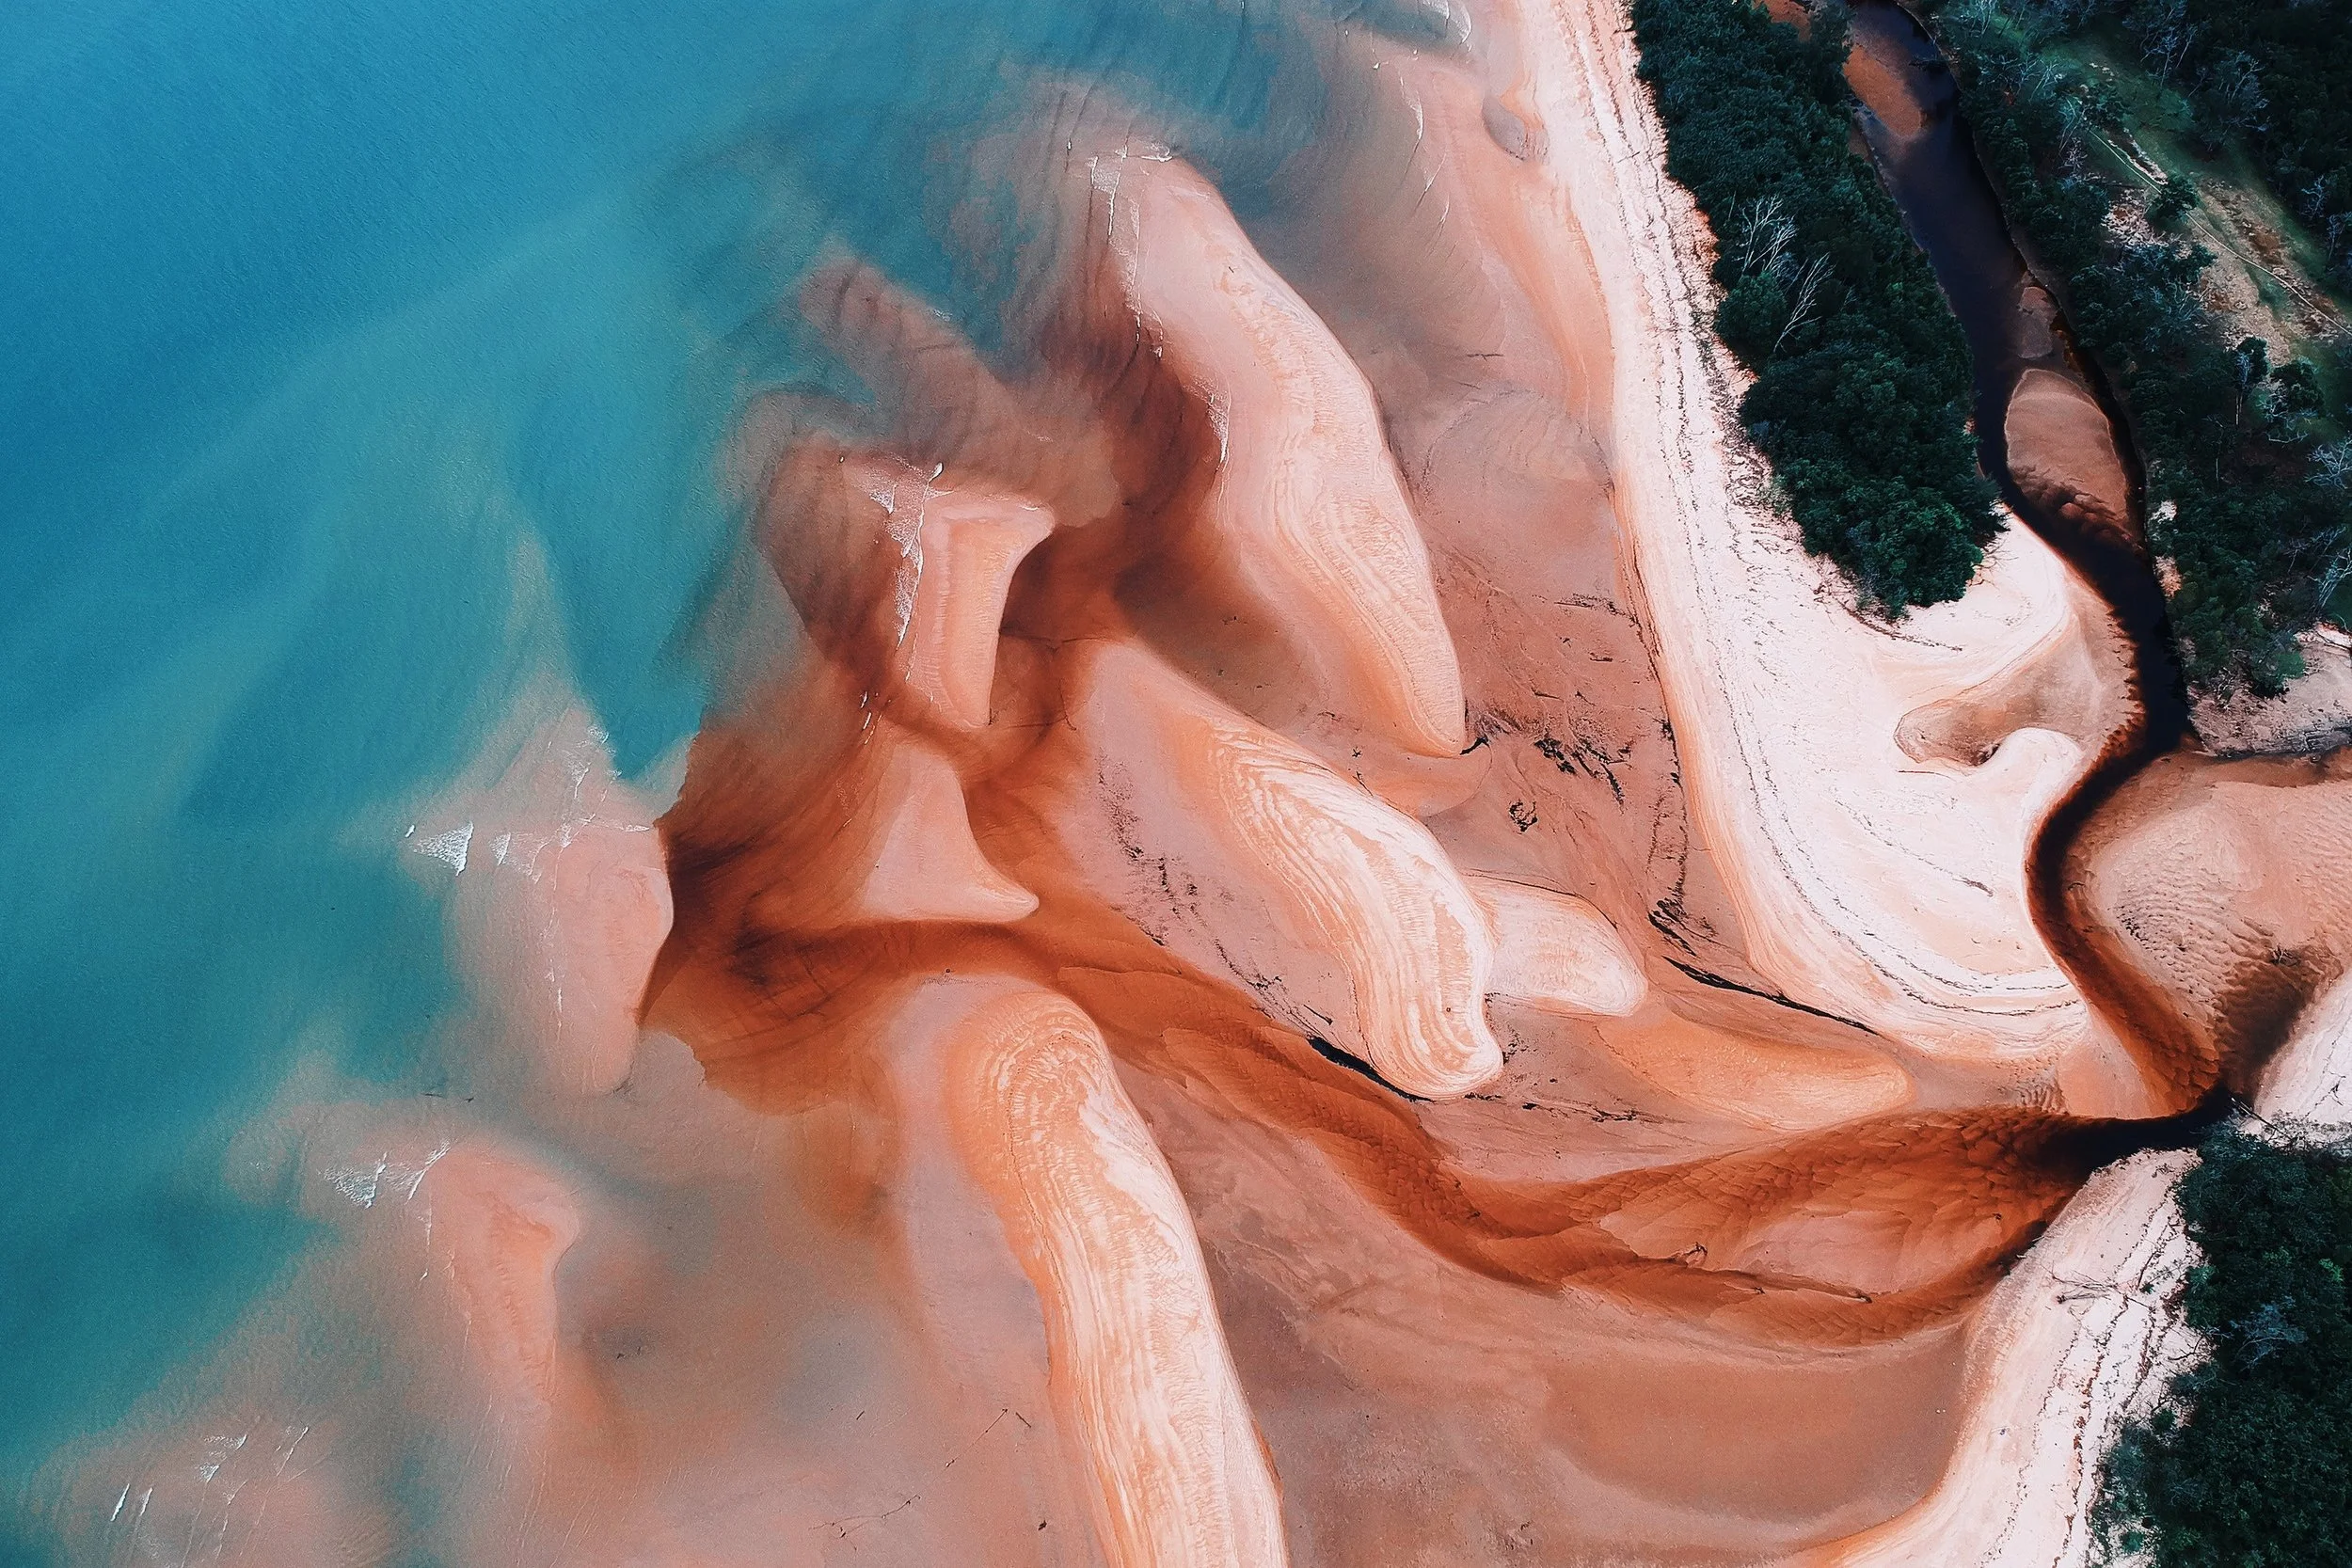
Environmental Drone Videography: We capture your rivers, reservoirs and catchments from every angle using aerial drone technology (DJI platform), to create a connection to your environmental systems without even leaving the office.
Virtual Reality: We bring your environmental data to life using the latest immersive technologies (Oculus Rift), creating a shared understanding and transforming stakeholder engagement.
Illustrations and Animations | Bring your data to life
A picture is worth 1000 words. We bring environmental data to life by combining illustrations and animations to transform our complex environmental systems into easy to understand pictures. Providing information in an accessible format ensures everyone is on the same page, to kick-start the conversation.
Our team of illustrators, computer animators and industry partners are specialists in:
Infographics, Schematics and Conceptual Models: We create simple illustrations and schematics within Adobe Illustrator and Photoshop to communicate complex environmental systems and core data insights.
Animations and Data Stories: We create short videos by combining computer animations (Adobe Creative Cloud), aerial footage and data visualisations to convey key project outcomes with clarity to project teams, organisations and communities.
Video Tutorials: We create customised video tutorials and interactive training manuals to quickly get project team members up to speed. Our “how-to” videos are perfect for documenting environmental model development, simulation and update procedures, providing a great alternative to lengthy reports.


Case Studies
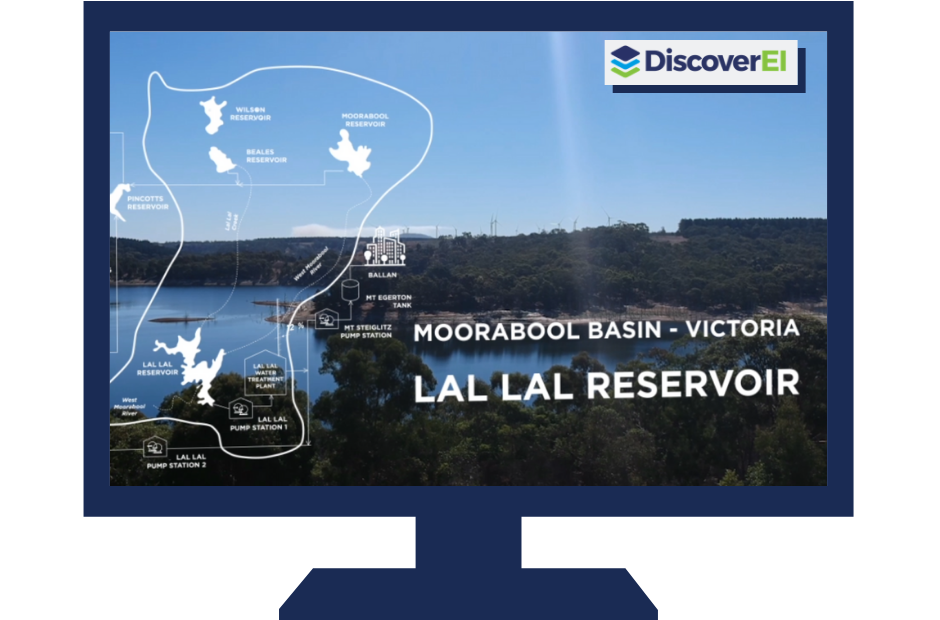
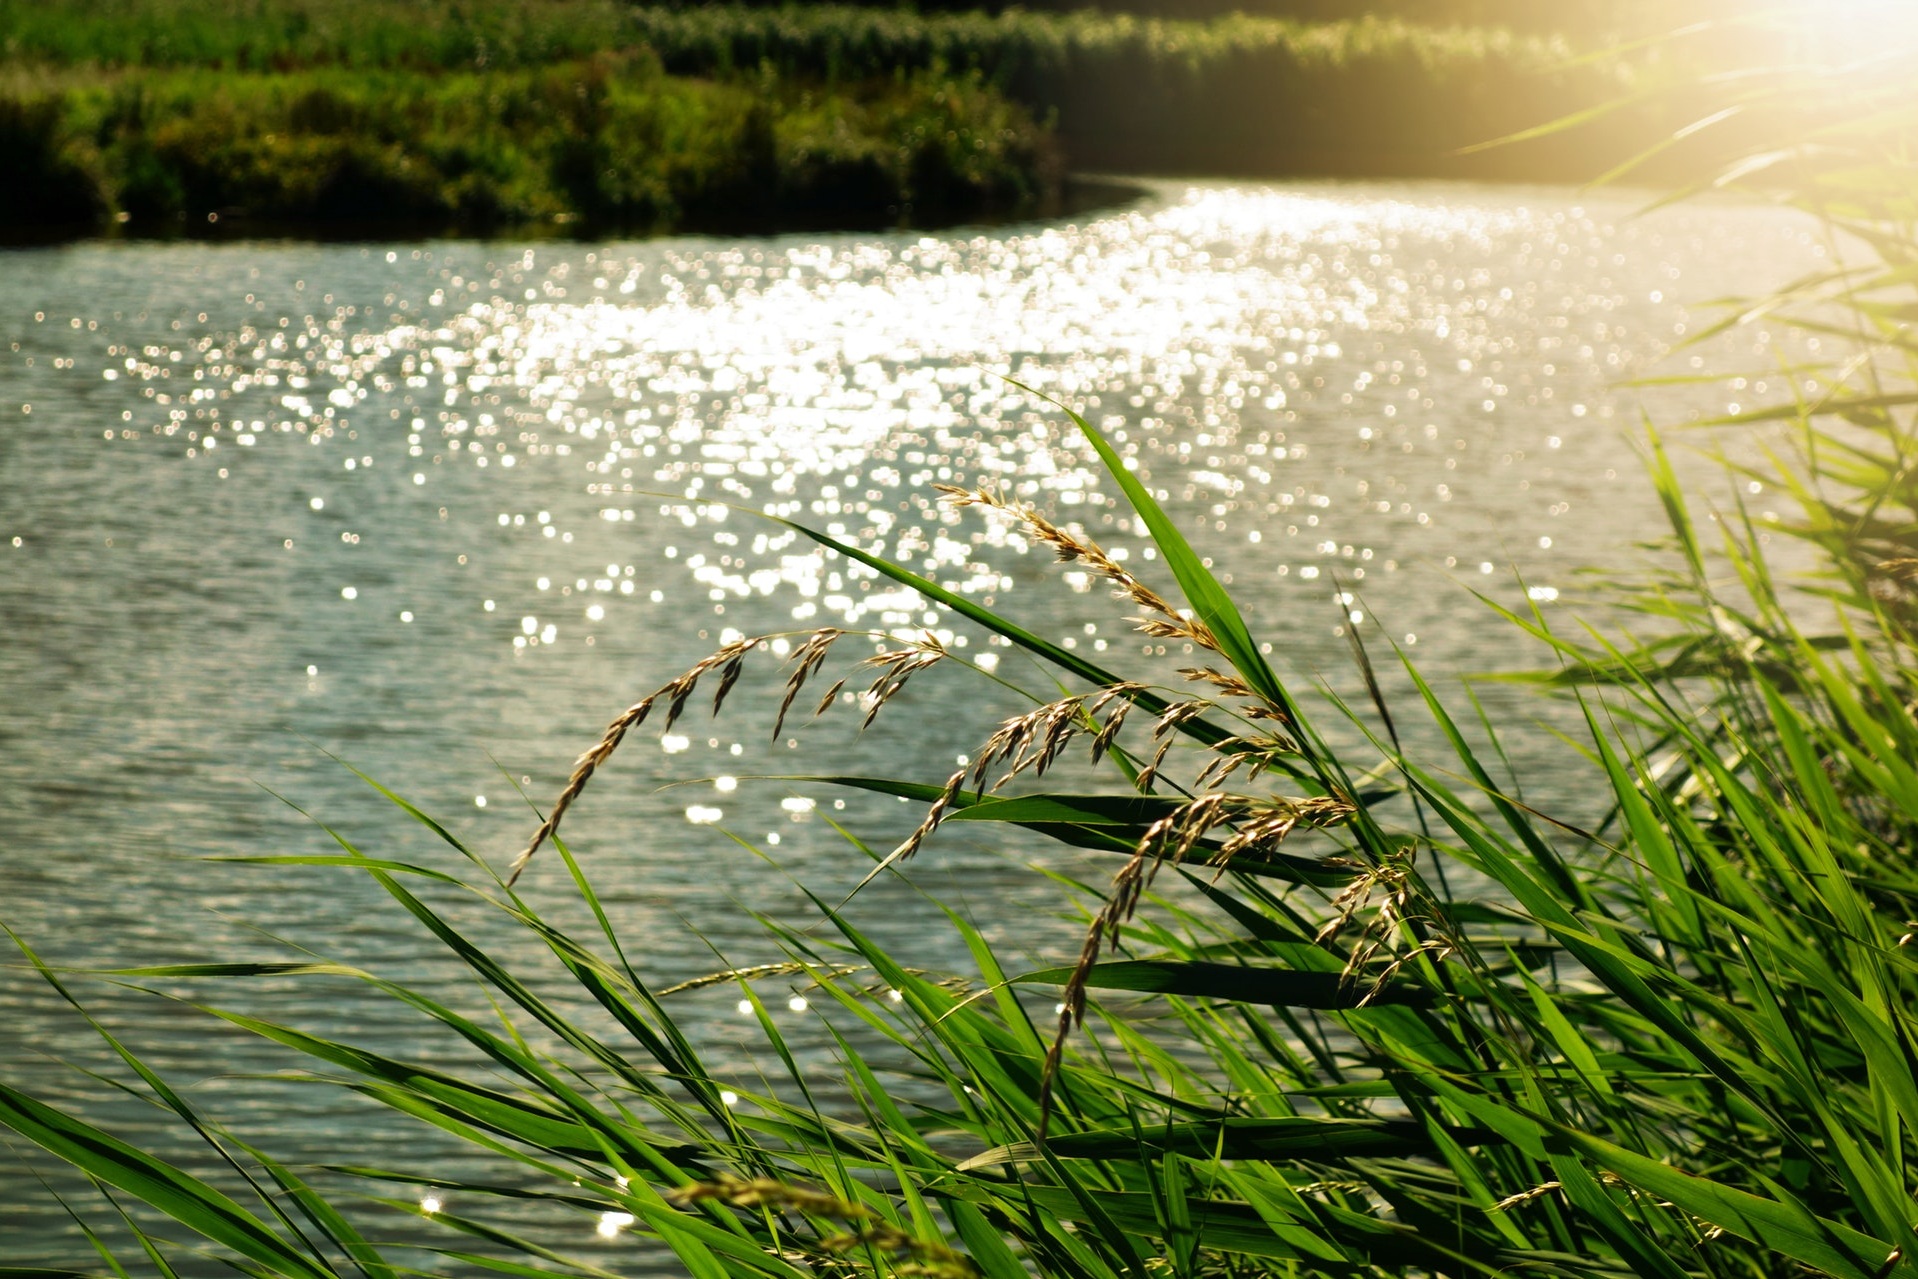
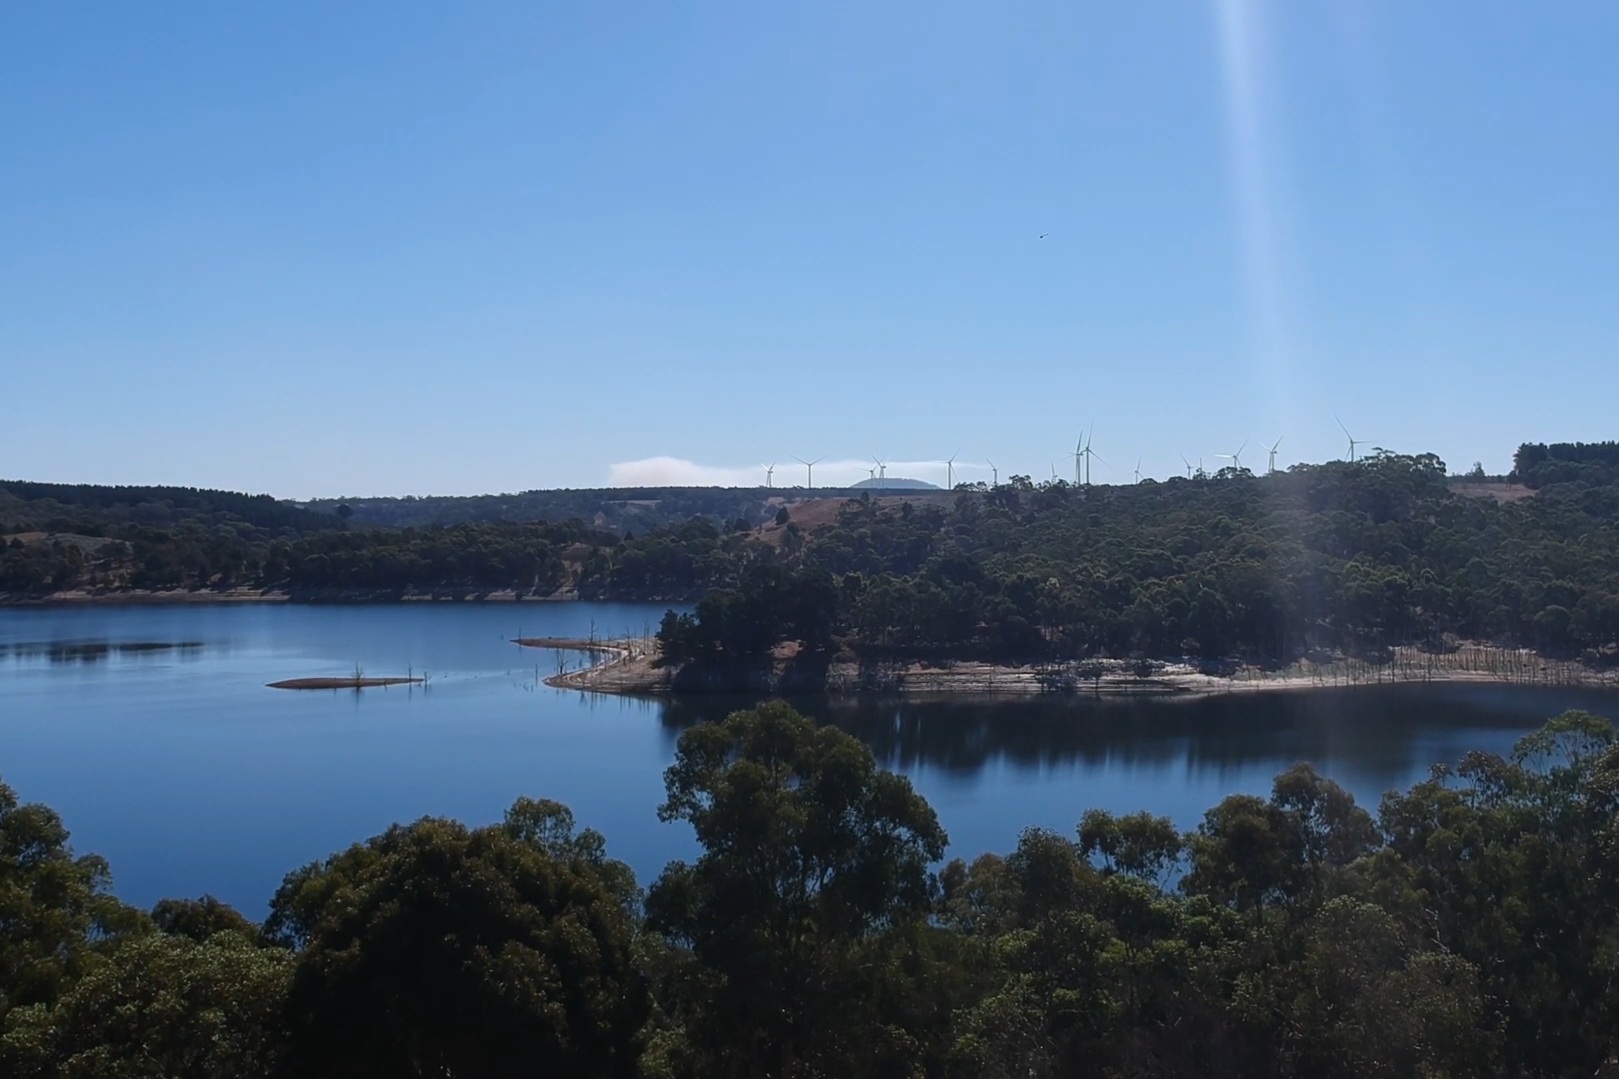
Exploring the Werribee catchment
We’ve just experienced another record breaking Australian summer, with January to April 2019 going down in the history books as Australia’s warmest start to the year.
We have been busy capturing the impacts on our rivers, reservoirs and catchments from every angle combining aerial drone footage with animations to help visualise and communicate these complex environmental systems. Take a look at one of our case studies we’ve prepared for the major reservoirs within the Werribee system in Victoria.

Environmental Modelling


Water Allocation Modelling | Sharing our water
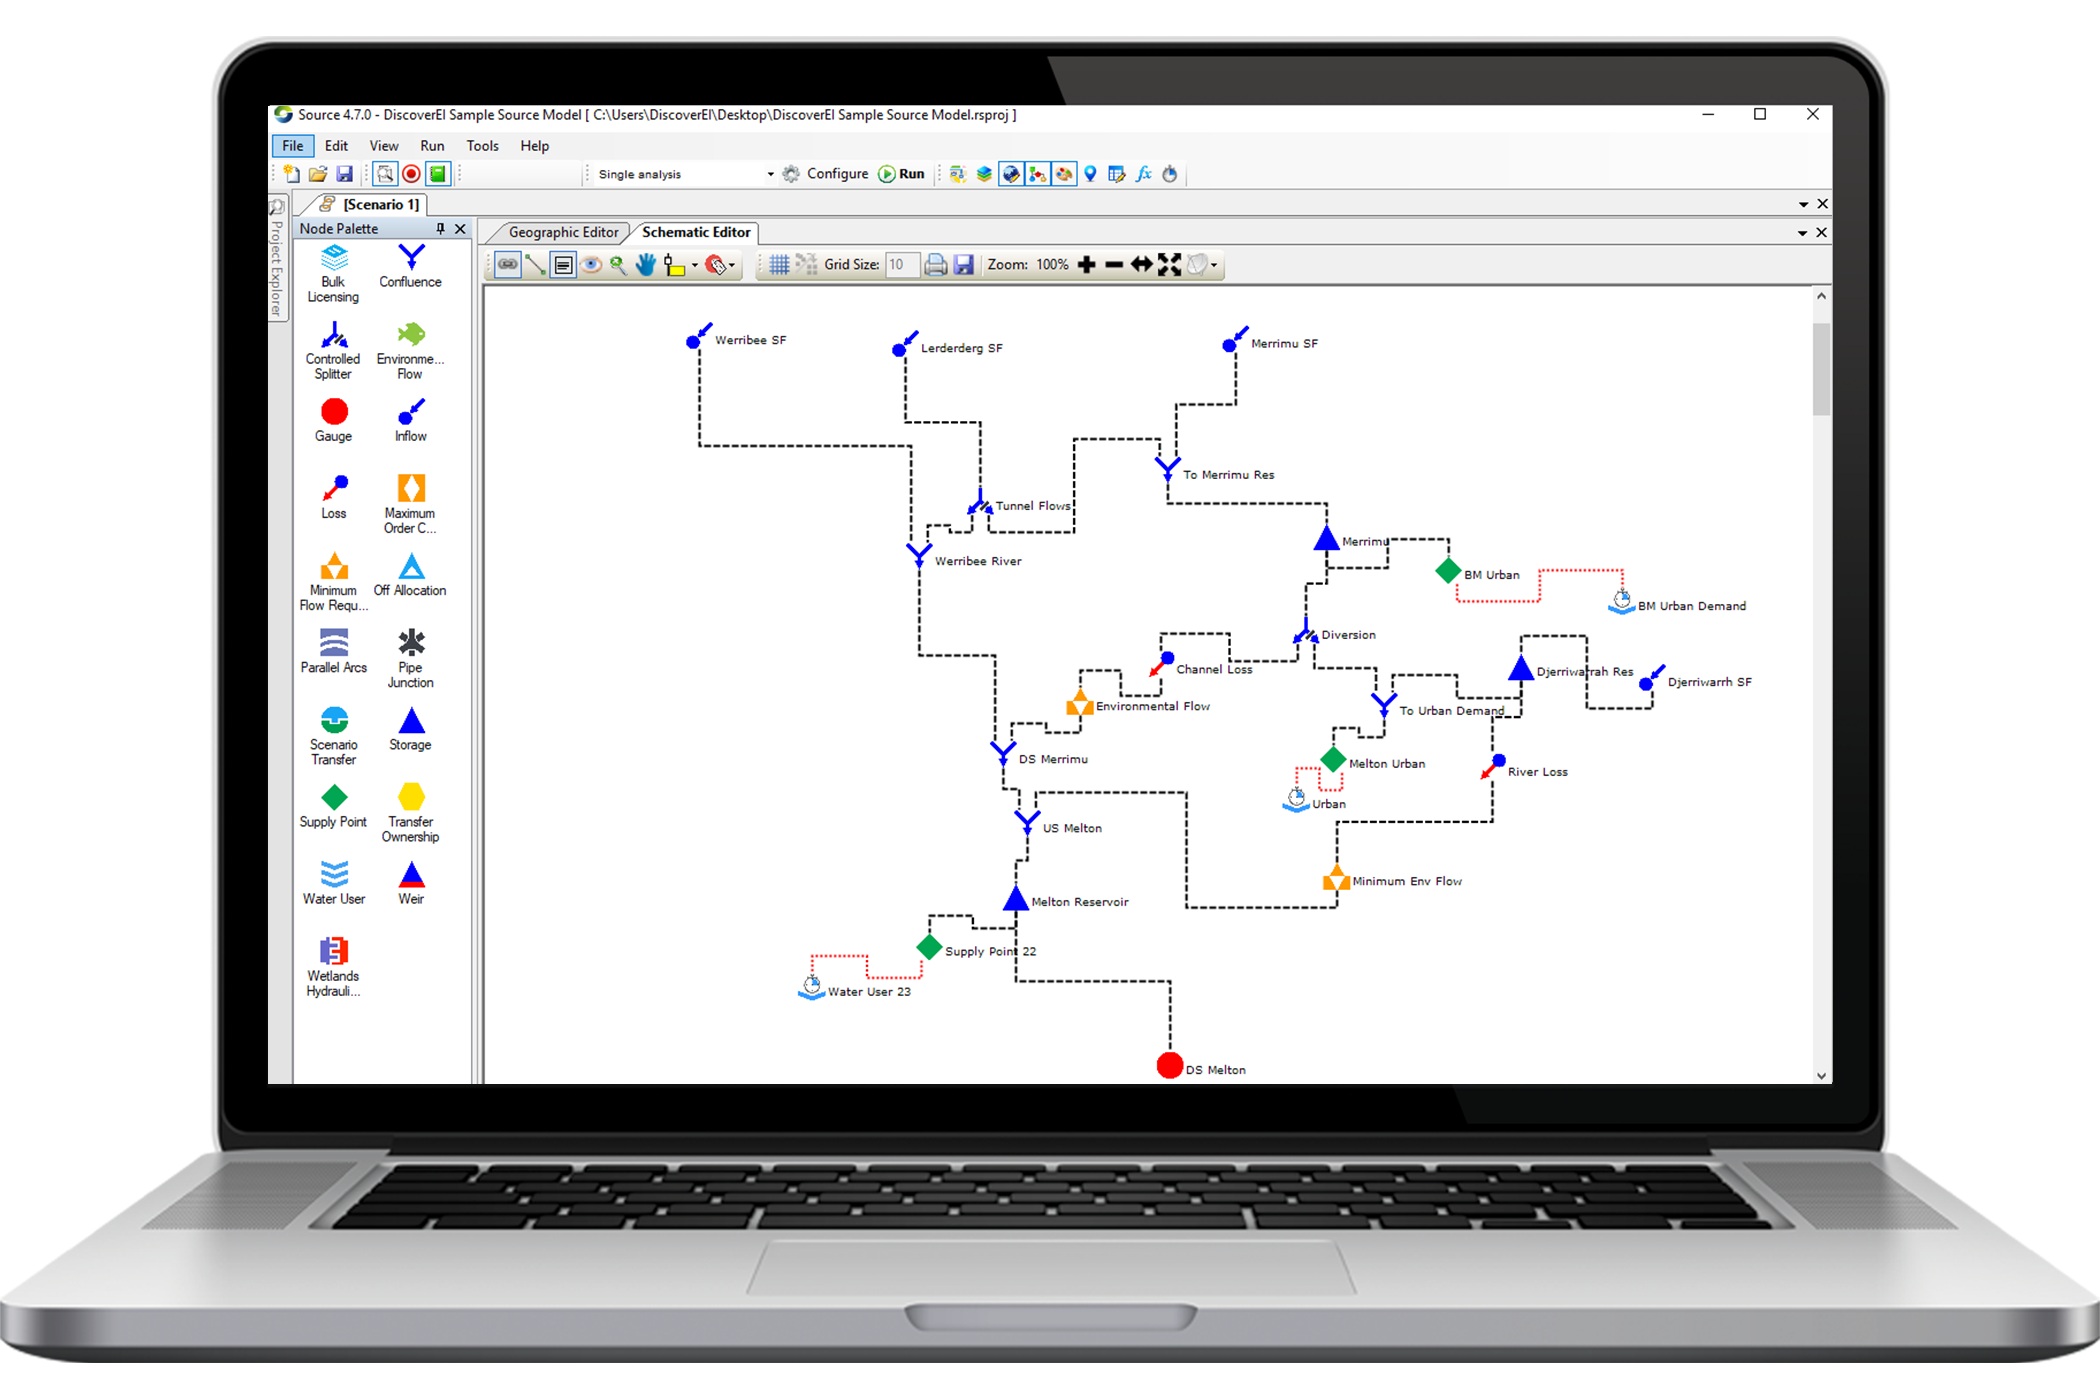
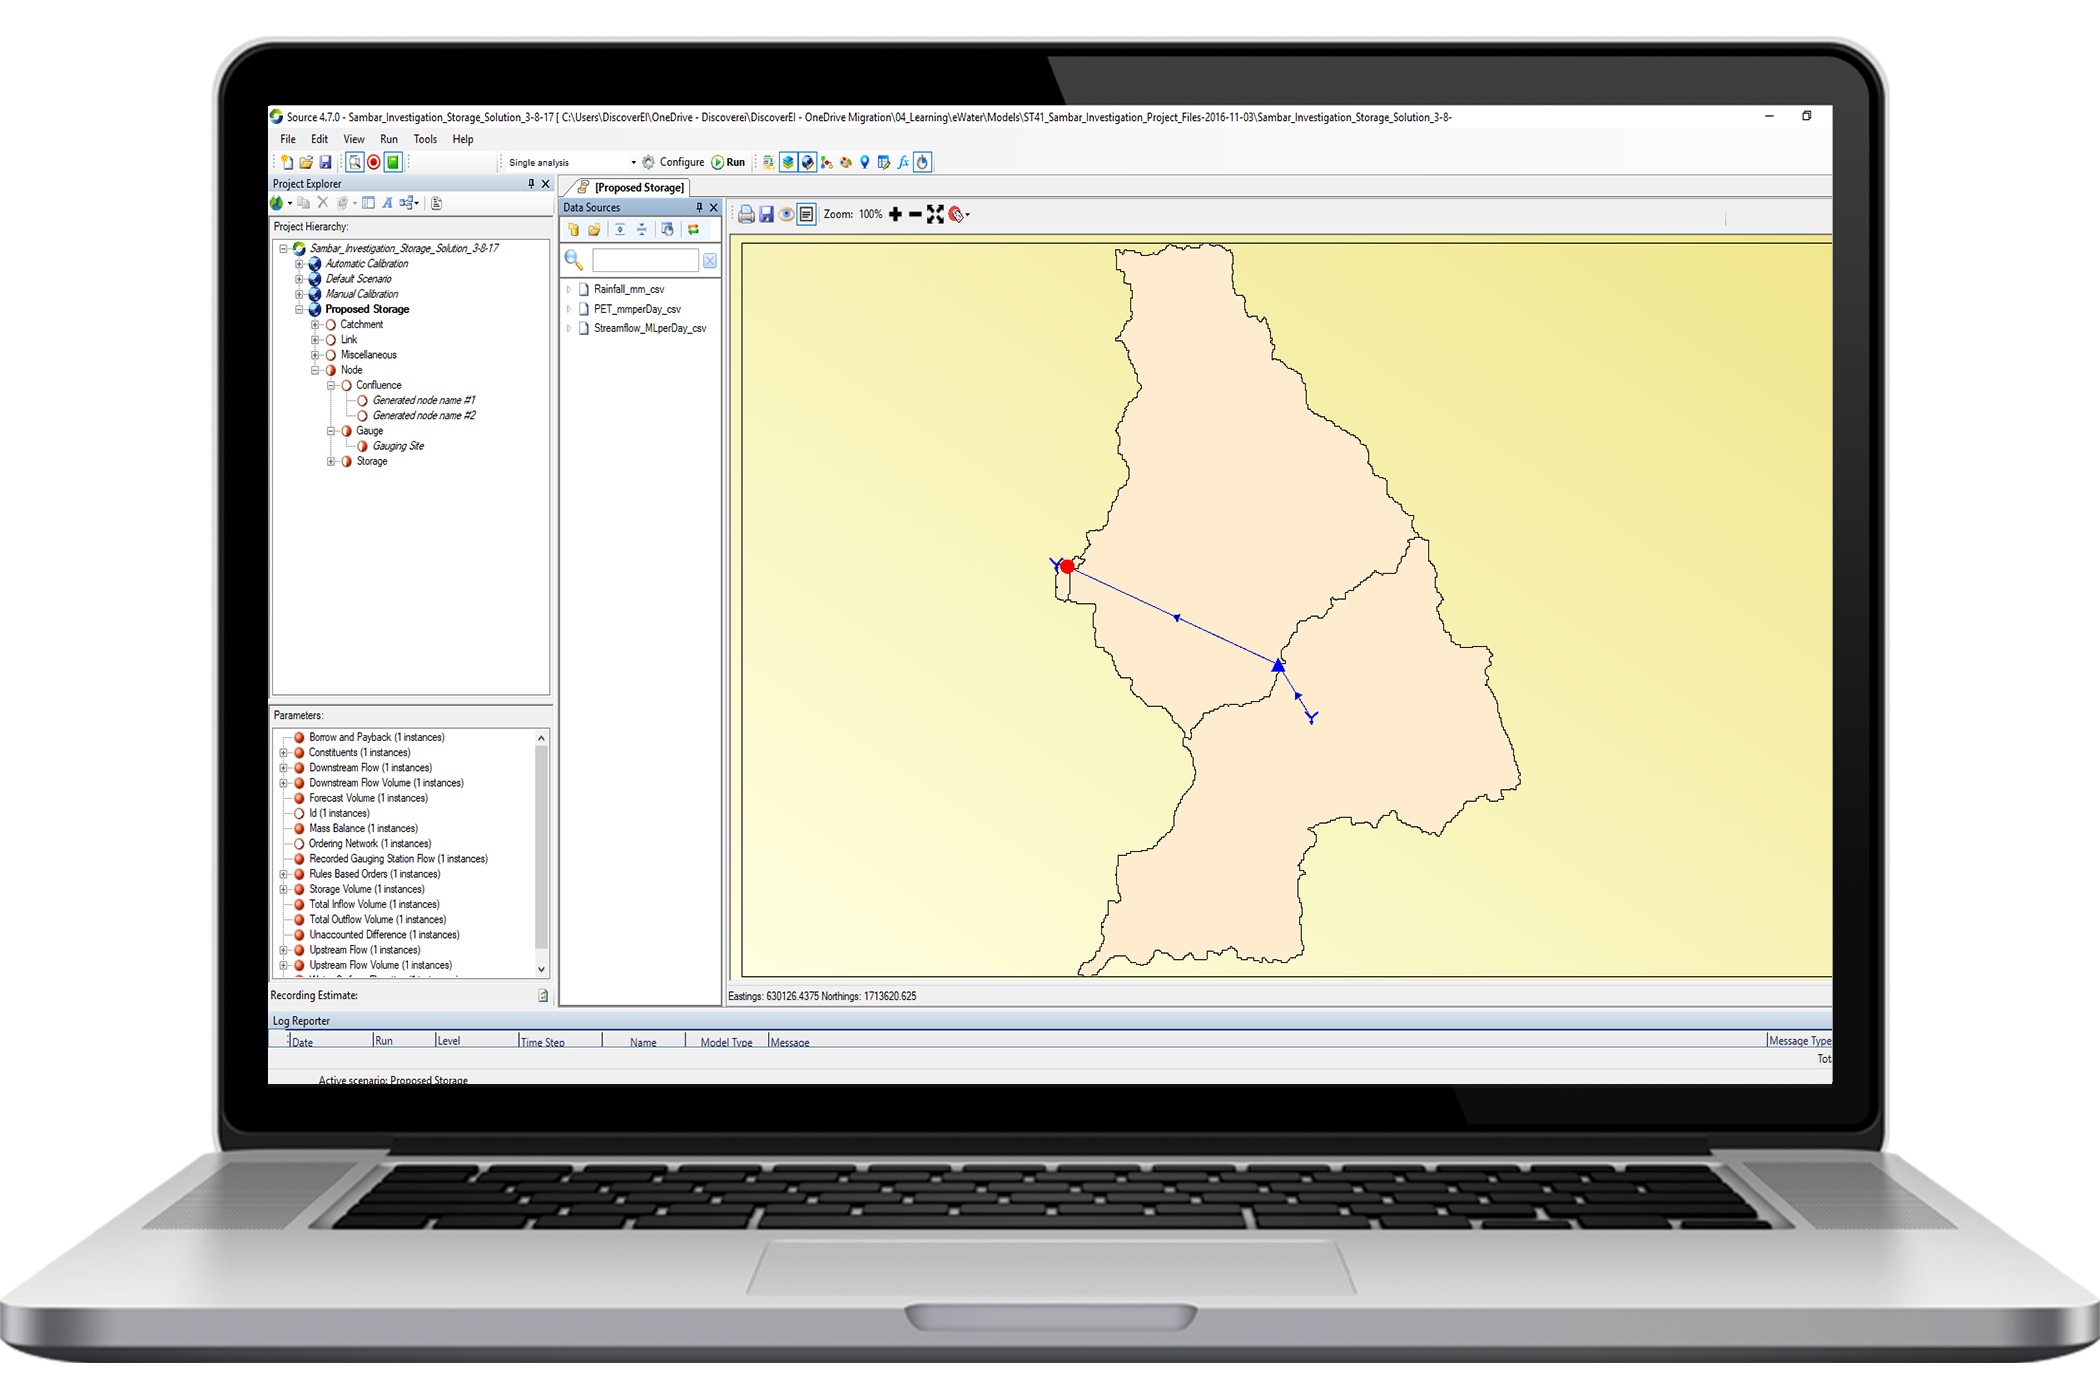
Water is a finite resource. We build water allocation models to help share our future water supply to meet competing demands from households, agriculture, industry and the environment. Using eWater Source, Australia's national hydrological modelling platform, we conceptualise, configure and simulate water resource models for different climate, demand and augmentation scenarios.
Our team of Environmental Engineers and industry partners are specialists in:
Catchment Hydrology: We combine spatial analysis, rainfall-runoff modelling, and rural demand modelling (irrigation and farm dam) to conceptualise our catchments.
Water Resource Modelling: We develop water allocation models (eWater Source and REALM) to inform water security outlooks, environmental flow regimes, and optimise water allocation under future climate, demand and augmentation scenarios. With access to the full licenced version of Source, we use advanced modelling techniques such as batch simulations via the command line and scenario input sets to automate your modelling processes.
Modelling Efficiency: We combine data analytics (Power BI), computer programming (Visual Basic Macros and DOS),and optimisation software (PEST) to streamline data processing and deliver our projects a whole lot more efficiently!
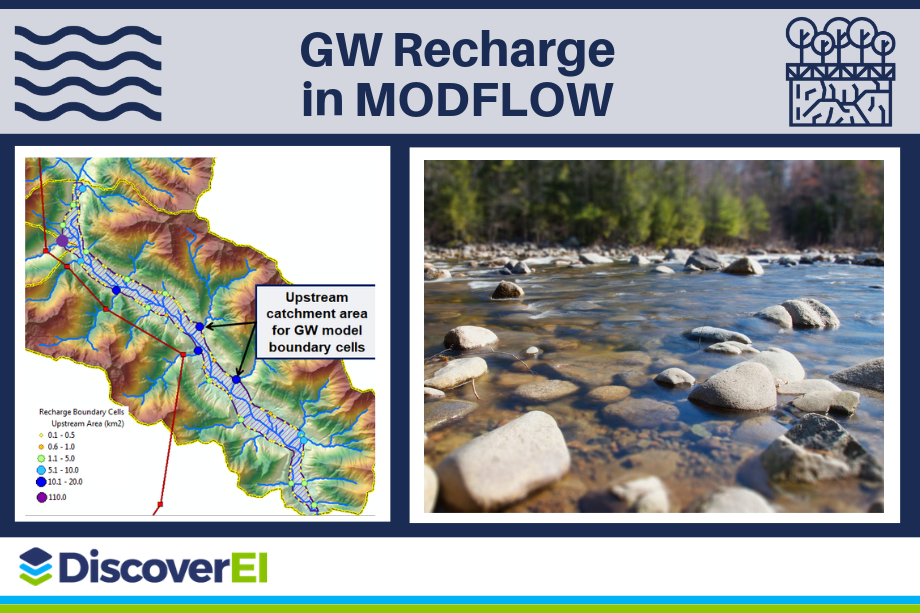
Groundwater Modelling | Managing our aquifers
We need to understand our aquifers before we can manage them. We partner with hydrogeologists to develop conceptual and numerical groundwater models of hydrogeological systems to help deliver sustainable yields whilst minimising potential impacts to our environment.
Our team of Environmental Engineers and industry partners are specialists in:
Hydrogeological Conceptualisation: We combine spatial analysis (ArcGIS, QGIS), data analytics (Power BI) and visualisation tools (Adobe Creative Cloud) to develop conceptual models of groundwater systems.
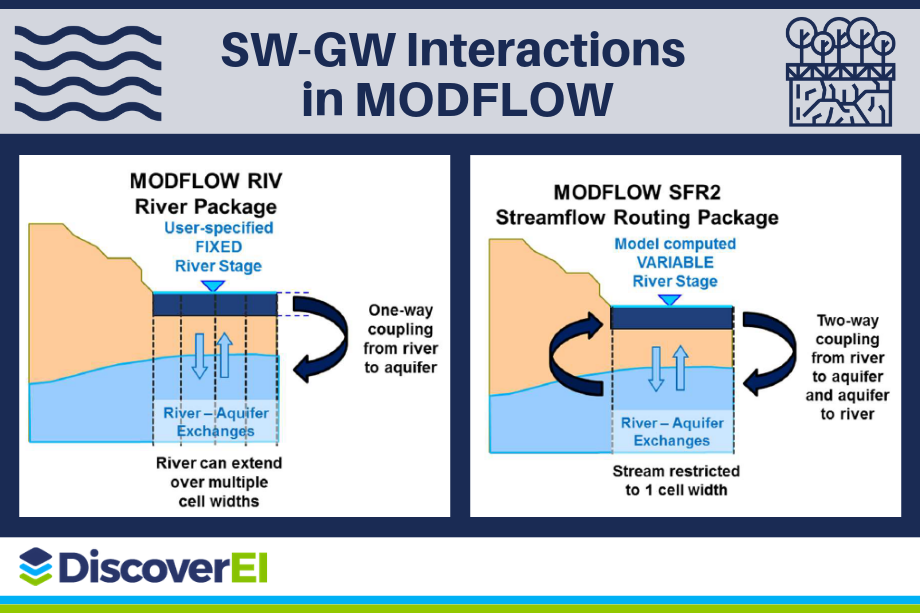
Surface Water - Groundwater Interactions: We compute interstation reach mass balances using surface water and groundwater chemistry, level and flow data to characterise baseflow contributions in our river systems.
Numerical Groundwater Modelling: We configure and calibrate 3D numerical groundwater models (MODFLOW suite and PEST) of aquifer systems, and streamline data processing through developing Excel Macro routines.


Environmental Site Assessment | Restoring our environment
Minimising our impact on the environment is important. We partner with environmental specialists to characterise contamination impacts within the soil, surface water and groundwater systems, to maintain environmental standards and manage contaminated sites.
Our team of Environmental Engineers and industry partners are specialists in:
Conceptual Site Models: We analyse spatial and chemistry data to identify potential contamination sources, pathways and receptors to conceptualise contaminated sites.
Environmental Data Analysis: We use the latest data analytics tools (Power BI) to streamline data processing, identify trends, exceedances and outliers in environmental time-series data and configure interactive dashboards to communicate your data.