
Top 5 Power BI Dashboard Design Tips

🎦 Check out our short video tutorial to see all the details in action 🎦
As data analysts, we spend a lot of time cleaning, shaping and analysing our data to answer key business questions. But with our heads down in the data, we sometimes lose sight of our ultimate goal: to turn this mountain of data into actionable insights that everyone can understand.
Now you may be thinking,“I’m a developer not a designer… !” But by mastering a couple of simple tips and tricks you’ll be transforming data into decisions in no time!
Here are our top 5 Power BI design tips to help you create really engaging and intuitive reports!
We’ll transform a pretty standard-looking Power BI report into a more engaging, intuitive dashboard to monitor the health of our rivers, wetlands and estuaries across Melbourne.
Our written blog provides a quick summary of the key takeaways. But make sure you watch our video tutorials as visual design is meant for viewing, not reading!

What we started with

What we have, 5 tips later…
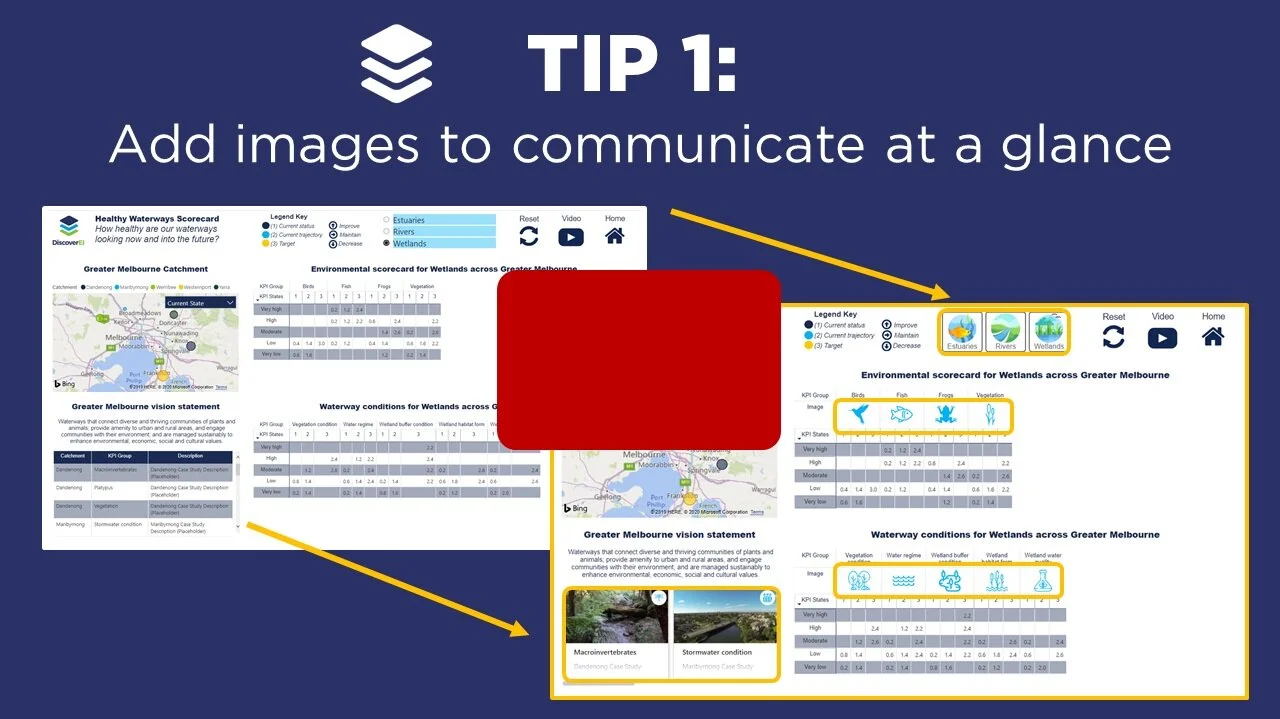
TIP 1: Incorporate Images
▶️ Skip ahead in the video to Tip 1 ▶️
Our first tip is to incorporate images into your reports. We process images much faster than text, so let’s use this to our advantage!
Before we dive in, you first need to know where to find, where to host, and how to import image URLs into Power BI reports. If you’re thinking, “Wait…I don’t even know where to find images, let alone host and incorporate a URL….?”, don’t worry, we’ve got all the details covered in our video on How To Incorporate Images into Power BI.
Power BI comes with loads of great visuals, which use images to communicate key messages at a glance. In our example, we add images into a matrix and also showcase two excellent custom visuals for displaying graphics: Chiclet Slicer and Card Browser.

We’ve made it really clear what waterways we’re slicing on by adding images using the Chliclet Slicer:
Import the Chiclet Slicer custom visual from the Market Place
Drag in your Image URL
Format Chiclet and image size
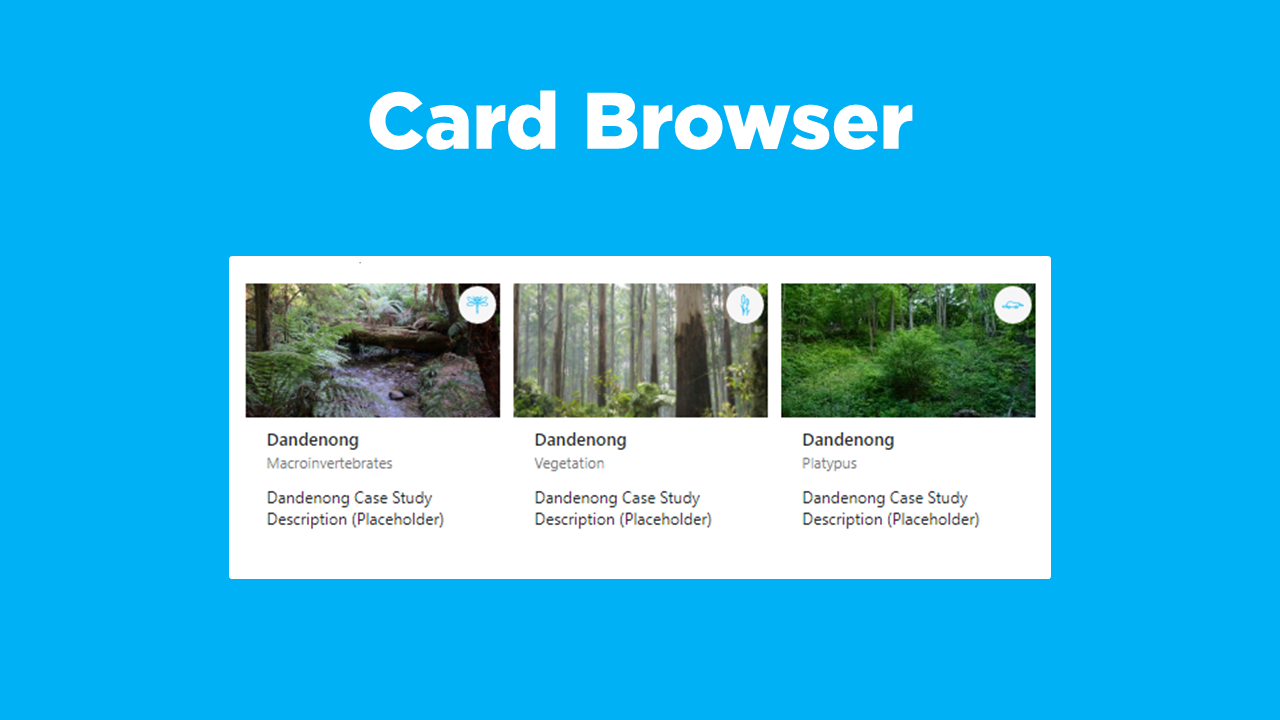
We’ve converted our table of waterway case studies into an image gallery using the Card Browser:
Import the Card Browser custom visual from the Market Place
Drag in image URLs of site photos and category badges
Fix up the formatting

These environmental scorecards are the most important visual in this report, and definitely the most confusing! Displaying images in the matrix column headers is one of our favourite ways to visually communicate the data:
Drag in Image URL into the column field well
Format image size
TIP 2: Simplify Visuals

▶️ Skip ahead in the video to Tip 2 ▶️
Noise is distracting! Our second tip is to simplify your visuals to make your key messages stand out.
In our example, the actual numbers in the environmental scorecard matrices aren’t critical. What’s most important is communicating the trends. One of our favourite ways to reduce the noise in Power BI is to use conditional formatting.
We’ve converted the numbers into icons using conditional formatting rules to visualise the key trends in the datasets. If you want to find out more on how to incorporate and customise icons in Power BI, Matt Allington’s blog post goes into all the details.

We’ve adding some icons into our matrix using conditional formatting rules. To get started:
Right-click on the Values and select ‘Conditional Formatting’ then ‘Icons
Select ‘Icon Only’ and adjust the rules based on the field value
Play around with the other formatting options and rules
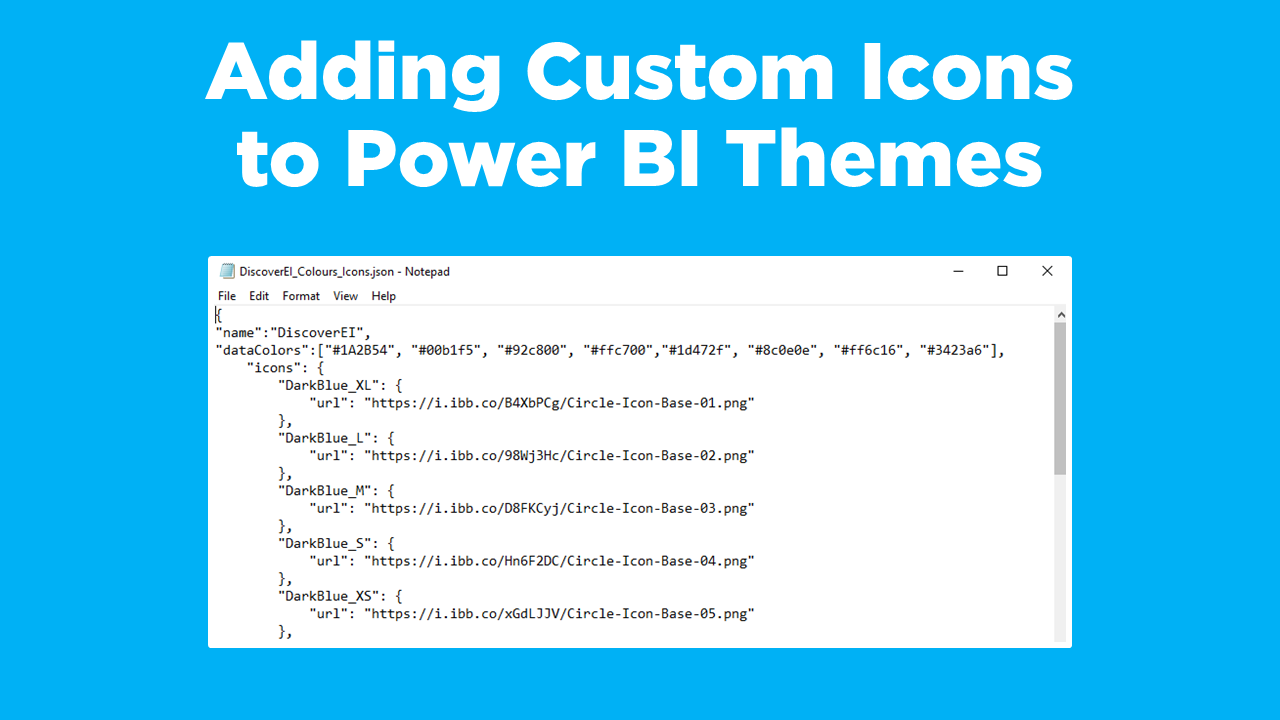
Power BI has some default icons, but sometimes you want to add your own to suit your report style or datasets. You can easily import your own icons by customising the Power BI theme file:
Export current theme file
Add image URLs in JSON syntax
Import back into Power BI
TIP 3: Select the right visuals

▶️ Skip ahead in the video to Tip 3 ▶️
Tip number 3 is to make sure you select the right visual for your data.
A couple of classic examples are to use bar charts when displaying text on axes, use line charts for time-series, and NEVER, under any circumstances use pie charts (just kidding…but seriously, some people totally have it in for pie charts… so don’t say we didn’t warn you!)
In our example, the default Bing map is really busy, and the points on the maps actually represent river catchments across Melbourne. Shape Map or MapBox are our go-to options for displaying regional datasets in Power BI. We’re pretty obsessed with MapBox and we’re going to dedicate an entire blog series to it at a later date. So in our example here we’ve converted it into a Shape Map.
If you’re struggling to find or create a spatial file, we’ve got you covered in our post on How To Create Custom Shape Maps for Power BI.

Before we dive in:
Create (or find) a spatial file in JSON format, and make sure that you have a common attribute in both your spatial layer and Power BI data model to connect to.
Activate ShapeMap in your Power BI file (it’s currently a preview feature)
We’ve got all these details covered in this blog post!

To create your own custom Shape Map:
Add the common attribute (i.e. present in both your spatial file and data model) to the ‘Location’ field well. In our example this is our river catchment names.
Select ‘Format’ then ‘Shape’ select ‘+ Add map’ and navigate to your JSON file
Play around with other formatting features such as adding colour saturation or auto-zoom.
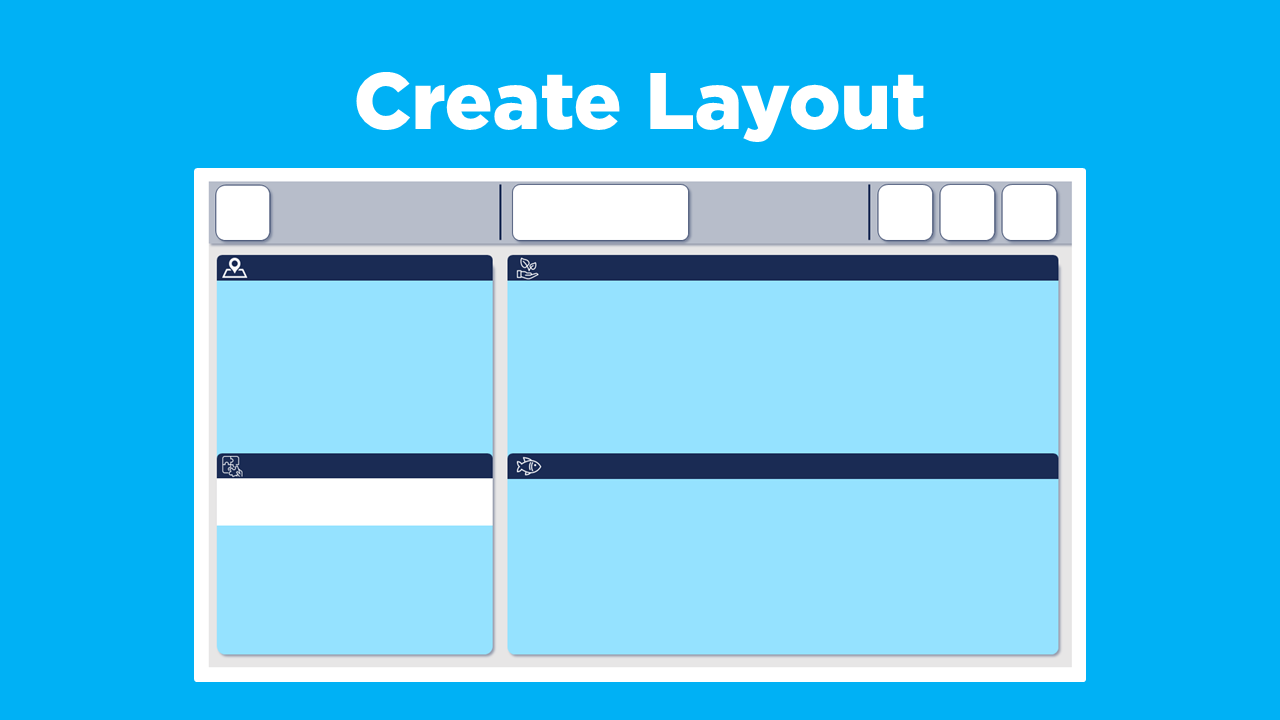
TIP 4: Use Layouts

▶️ Skip ahead in the video to Tip 4 ▶️
Tip number 4 is to use a layout to give your dashboard structure.
In the same way that you organise a written report into chapters, adding a layout to your dashboard helps narrate your data story and guide your audience to the key insights. Layouts also create a sense of consistency between your reports and give them a really professional feel.
To design a layout you can either layer lots of individual shapes in Power BI, or you could import your layout as a background image into Power BI - which is what we’ve done in our example. There are advantages and disadvantages of both approaches, which we’ll cover in detail in a future blog post (so stay tuned!). In the meantime check out Chris Hamill’s post on the What, Why and How of adding backgrounds to your Power BI reports.
To create a layout there are a two common approaches:
Design one yourself in PowerPoint; or
Head across to PowerBI.tips and purchase some of their amazing layouts created by applying best practice graphic design principles.
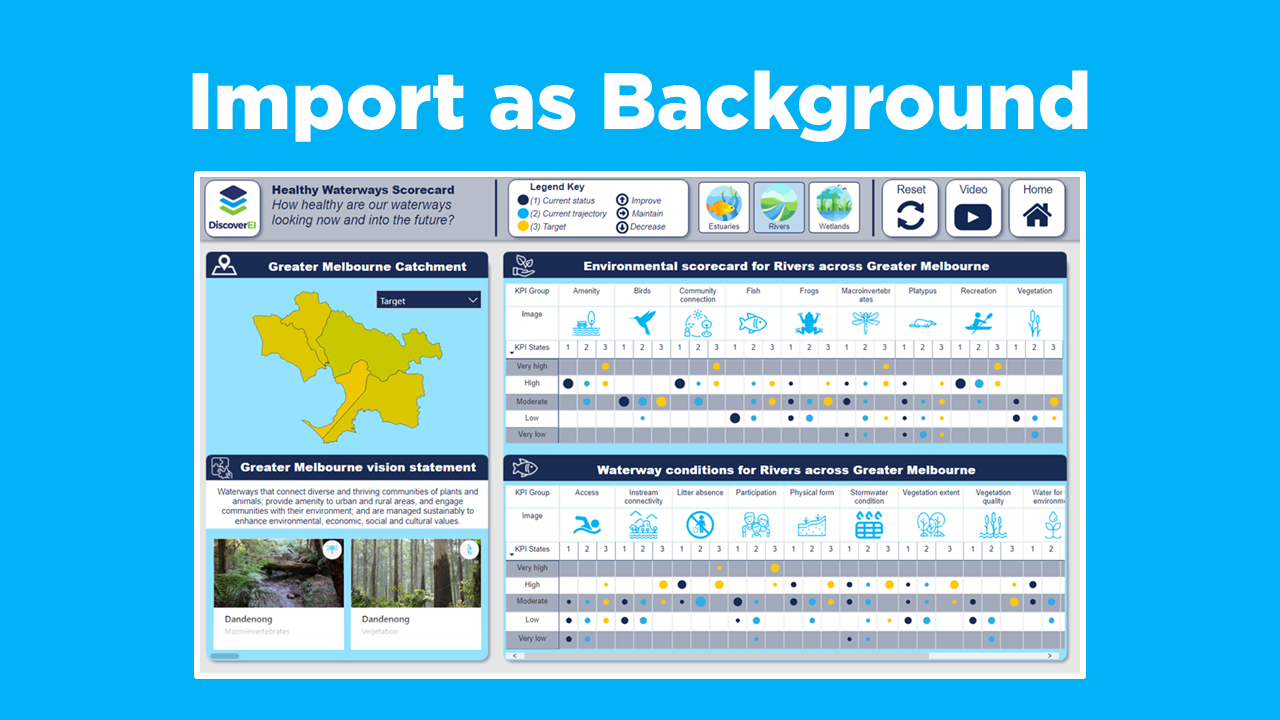
Import your very cool background into Power BI:
Select your report page and ‘Format’, select ‘Page Background and ‘+ Add image’. Lastly, adjust the transparency and fit to page
Align your visuals to fit your background and fix up any formatting
TIP 5: Context is Key

▶️ Skip ahead in the video to Tip 5 ▶️
Our final tip to round out our top 5 is to always add context!
No matter how good our data is - it’s meaningless without the ability to easily navigate the different visuals and translate numbers into insights. As analysts, our role is to design reports with all users in mind - from those who love getting down in the detail, to those who just want the big-picture, and for everyone in between.
Adding report page tooltips is our favourite trick for quickly providing context without taking up your previous report real-estate. In our example, we show how to add report page tooltips to both your visuals and visual headers. We have dedicated an entire video to this concept if you want to find out more details!

To add report page tooltips to your visuals:
Create a report page tooltip page (see blog post)
Select visual and ‘Format’, then choose ‘Tooltip’. Set ‘Type’ as ‘Report page’ and Select your visual ‘Page’
When we hover over the visual, we can now see a lot more supporting information for the given context to help users interpret the data.

Adding tooltips to your visual headers is a great way to help users navigate visuals:
Create a tooltip page embedding a navigational GIF (see blog post)
Select visual and ‘Format’ then choose ‘Visual Header’ and Toggle on ‘Visual header tooltip icon’. Select your ‘Report page’
When we hover over the question mark icon in the visual header, we can now see how to navigate these visuals.
In Summary…
Applying our 5 simple tips we transformed a pretty boring and confusing report into a really engaging and interesting dashboard.
Head across to the Power BI Data Stories Gallery to play around with our Power BI report for yourself!!

Do you have your own awesome Power BI design tips? Or have any questions, comments or suggestions for future blog posts…?
Please post in the comments below - we’d love to hear from you!
Power BI Training Courses
We’re really excited to announce the DiscoverEI teams virtual 2-day Power BI training courses, to fast-track your Power BI journey. Click on the links below to learn more, or get in touch today!
Purchase Training


Do you want to learn how to design engaging and intuitive Power BI reports, which communicate your key insights at a glance and tell your data story?
Our two-day Power BI training course is designed specifically for Power BI Professionals and Data Analysts, and provides our best practice tips, tricks and hacks to help you transform your data! We provide this course online, in-person group sessions, or customised in-house training for your team. Places are limited (max 8 participants per class) so secure your spot today!