
Visual calculations in Power BI, a Christmas miracle??
The "Power BI and Data Analytics for Enviros" meetup group is all about sharing tips, tricks and hacks for analysing, visualising and communicating environmental data. The purpose of this blog is to summarise the key take-aways from the sessions, to help with sharing knowledge, empowering others and creating a strong data culture across our community.
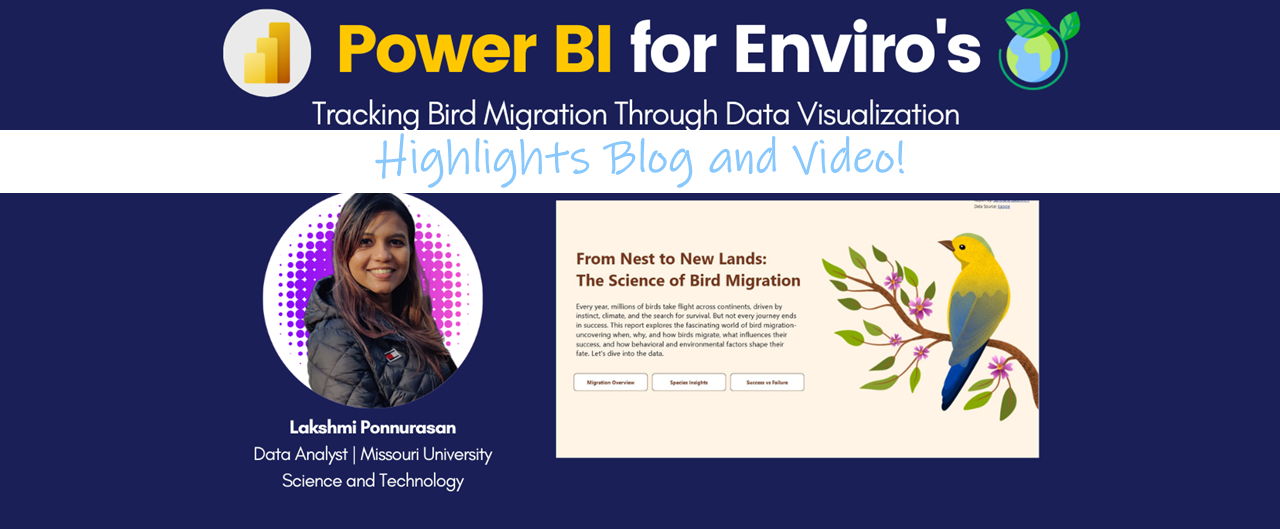
November 2025: Session summary
In this session, Daniel Marsh-Patrick (Coacervo | DiscoverEI) took us through the recently released Visual Calculations in Power BI. Using a simple dataset, Daniel explained the basics of this technique and demonstrate practical use cases where Visual Calcs can be used to replace often semi-complex DAX statements. Some of the key learning resources for Visual Calcs and DAX in general include:
Visual Calcs MS learn: https://learn.microsoft.com/en-us/power-bi/transform-model/desktop-visual-calculations-overview
SQLBI DAX guide: https://dax.guide/
MS Docs DAX Reference Guide: https://learn.microsoft.com/en-us/dax/
Visual Calcs book: https://www.microsoftpressstore.com/store/microsoft-power-bi-visual-calculations-simplifying-9780135396926
A few of the screenshots of Visual Calculations in action to create climate stripes using a column chart are shown below:


The full recording is available through the YouTube link below.
November 2025: Guest speaker Daniel Marsh-Patrick
During his career working across the UK and New Zealand, Daniel has helped drive enterprise-wide solutions through process and software engineering, predominantly through Business Intelligence (BI), data visualization, and software integration.
He is highly passionate about the Microsoft BI stack, particularly Power BI, and has delivered Power BI solutions since 2014. He is a Microsoft Data Platform MVP, contributing free and open-source custom visuals to the Power BI Marketplace, and a Power BI Community Super User. He regularly presents and blogs on a variety of Power BI subjects.
Daniel aims to empower people with the knowledge and tools to make their workdays easier by eliminating the tedious bits through software and/or common sense. He enjoys sharing the knowledge he has gained with anyone who desires to learn these skills for themselves.
Sign up now for the meetup here: https://www.meetup.com/en-AU/powerbi4enviros - and if you have ideas for a future session then please let us know at info@discoverei.com .

Power BI Training Courses
If you’re interested in learning from our team, then we have a range of 2-day Power BI training courses available to fast-track your Power BI journey.
Click on the links below to learn more, and get in touch with the team today!
Purchase Training


Do you want to learn how to design engaging and intuitive Power BI reports, which communicate your key insights at a glance and tell your data story?
Our two-day Power BI training course is designed specifically for Power BI Professionals and Data Analysts, and provides our best practice tips, tricks and hacks to help you transform your data! We provide this course online, in-person group sessions, or customised in-house training for your team. Places are limited (max 8 participants per class) so secure your spot today!