
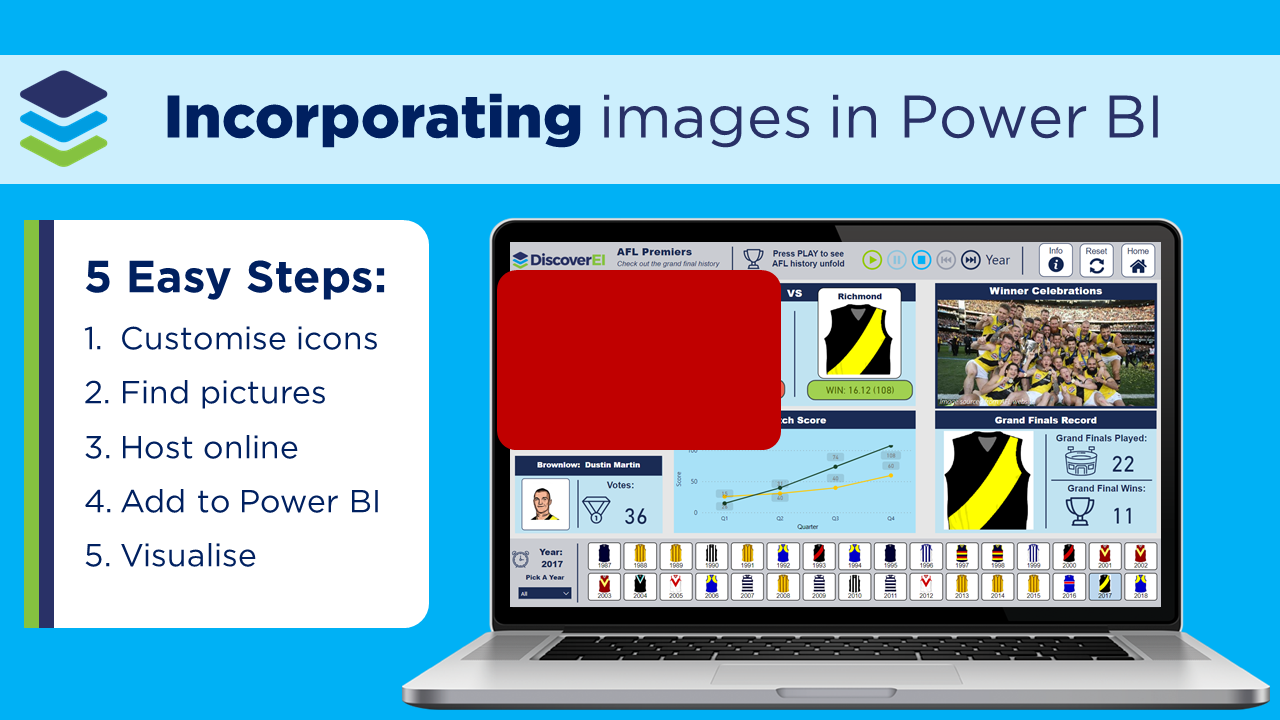
How to Find, Host and Add images into Power BI
🎦 Check out our short video tutorial to see all the details in action 🎦
Adding images into Power BI reports is a fantastic way to quickly communicate your key insights at a glance! Working within the environmental industry, there are lots of opportunities for us to embed site photos and fun animal and water icons into our dashboards. However, that means that we first need to find these images, and then host them online to generate the image URL that Power BI requires.
In this post we share our favourite tools to find and host images, and show how we incorporate images into Power BI reports!
And why are images so important? Just take a look at this before and after, where adding a few icons and photos can really transform your dashboards and help tell your data story. After mastering a few simple tips and tricks, you’ll have the confidence to incorporate images into your own dashboards in no time!
And if you’re still not convinced, Miguel Myers just released an amazing video on his YouTube channel (biDezine - check it out if you haven’t heard of it!) which goes over the Top 4 Tips to Improve Analysis with Pictograms in Power BI.
Before…

After…

This post is part of our blog series where we unpack our demo dashboard we developed using publicly available data for Melbourne’s Healthy Waterways Strategy. To see the whole dashboard in full - check our our Top 5 Dashboard Design Tips Post.
As always, our written blog provides a quick summary of the key steps. Make sure to watch the videos as visual design is meant for viewing - not reading 🤩
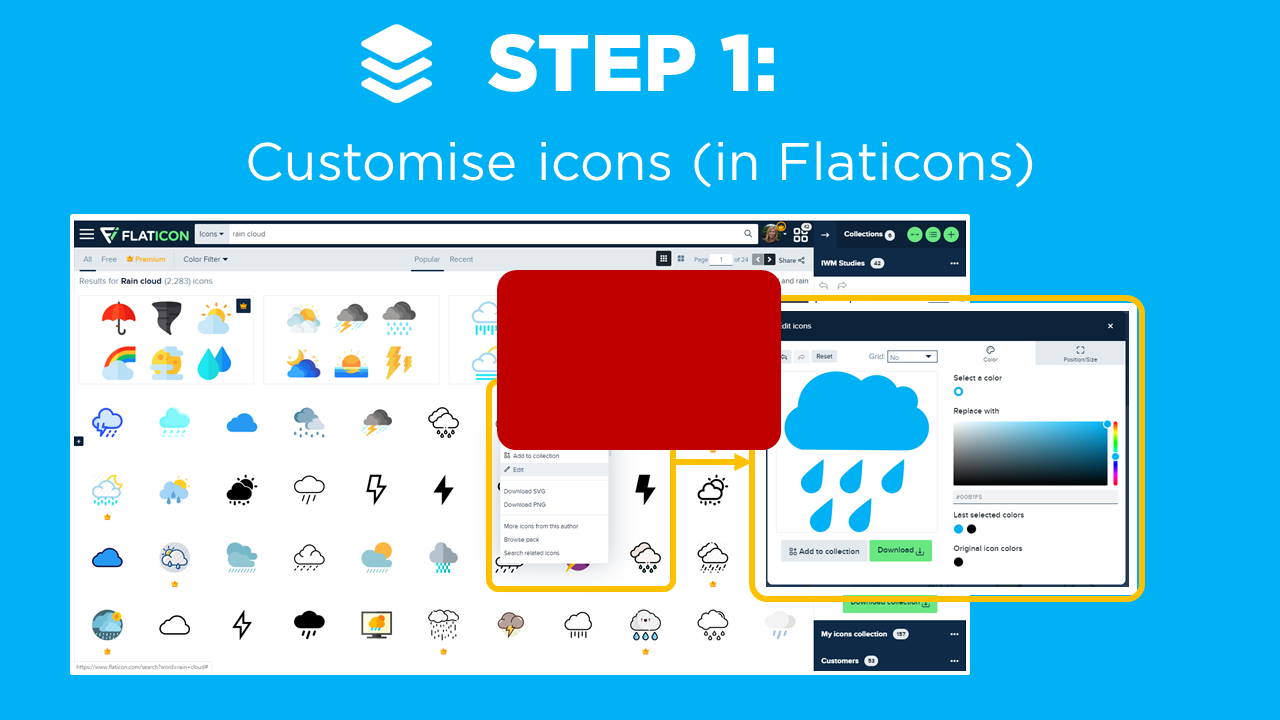
STEP 1: Customise Icons
▶️ Skip ahead in the video to Step 1 ▶️
Icons are a fantastic way to quickly provide context and visually communicate the key message of different visuals.
And luckily we have Flaticons! With over 2 million customisable vector icon designs, Flaticons is our favourite icon library. One of the best features is being able to customise the colours, create your own icon collections, and download these in a variety of formats.
Once you’ve set up a free Flaticons account, all you need to do is:
Browse the libraries and find the icon you’re after.
Customise colours and styles.
Save and download
A word of caution: the free licence requires attribution to Flaticons. Upgrading to Premium gets around this issue. Other great icon libraries include: Iconscout, Icons8, and IconFinder.

Add icons as bookmarks is a great way to help your users quickly navigate between your report pages.

Icons also provide context to help communicate key metrics, whether it be financial, climate or water related

This dashboard uses icons as tooltips to visually explain the meaning behind a range of water-related terms.
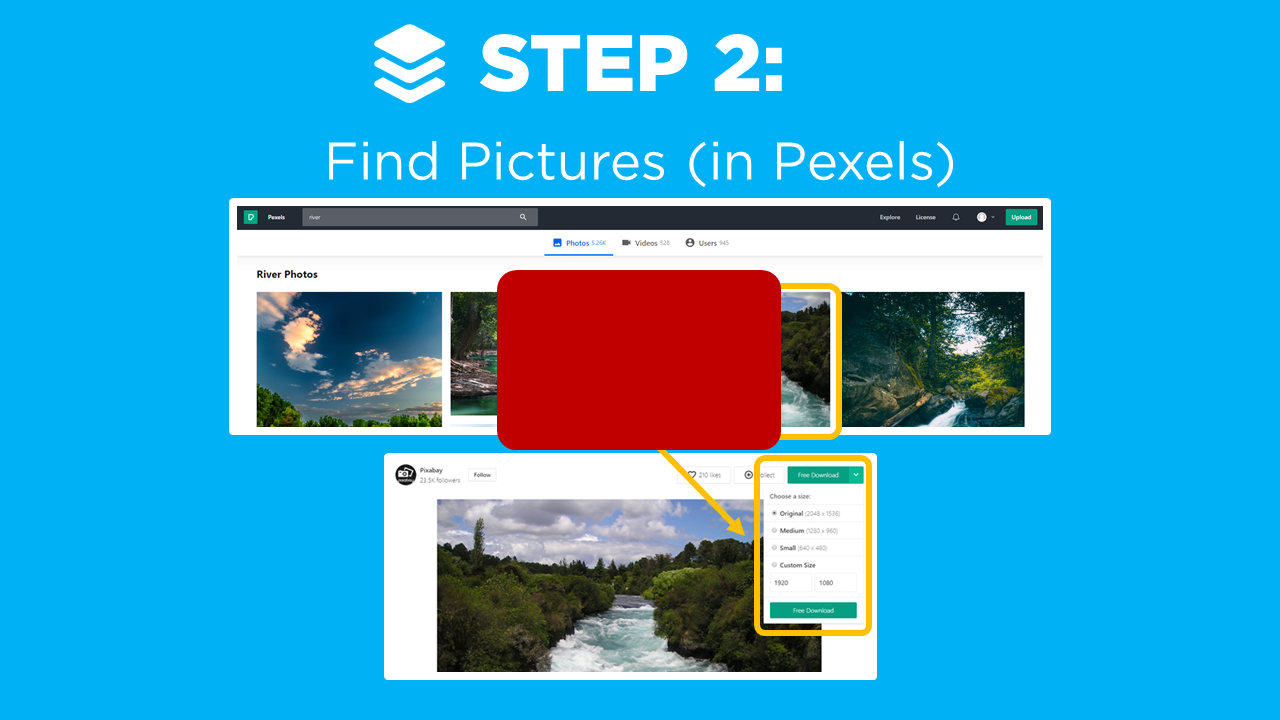
STEP 2: Find Pictures
▶️ Skip ahead in the video to Step 2 ▶️
No need to worry if you don’t have your own images - there are a lot of great image sites out there…and both Pexels and PikWizard, are two of our favourites for free stock images.
The best part is that there are no complicated licencing options - where photos can be used for free. Attribution is not required (it is encouraged!) and you can modify the photos however you like!
The key steps for downloading from these libraries are:
Browse the libraries and find your image
Save and download
It’s that easy!
Other great stock image libraries we commonly use include: UnSplash and Burst. Take a look below at a few examples of how you can build in your own images!

Here we use the Image custom visual as a tooltip, to transform points on a map into reality.
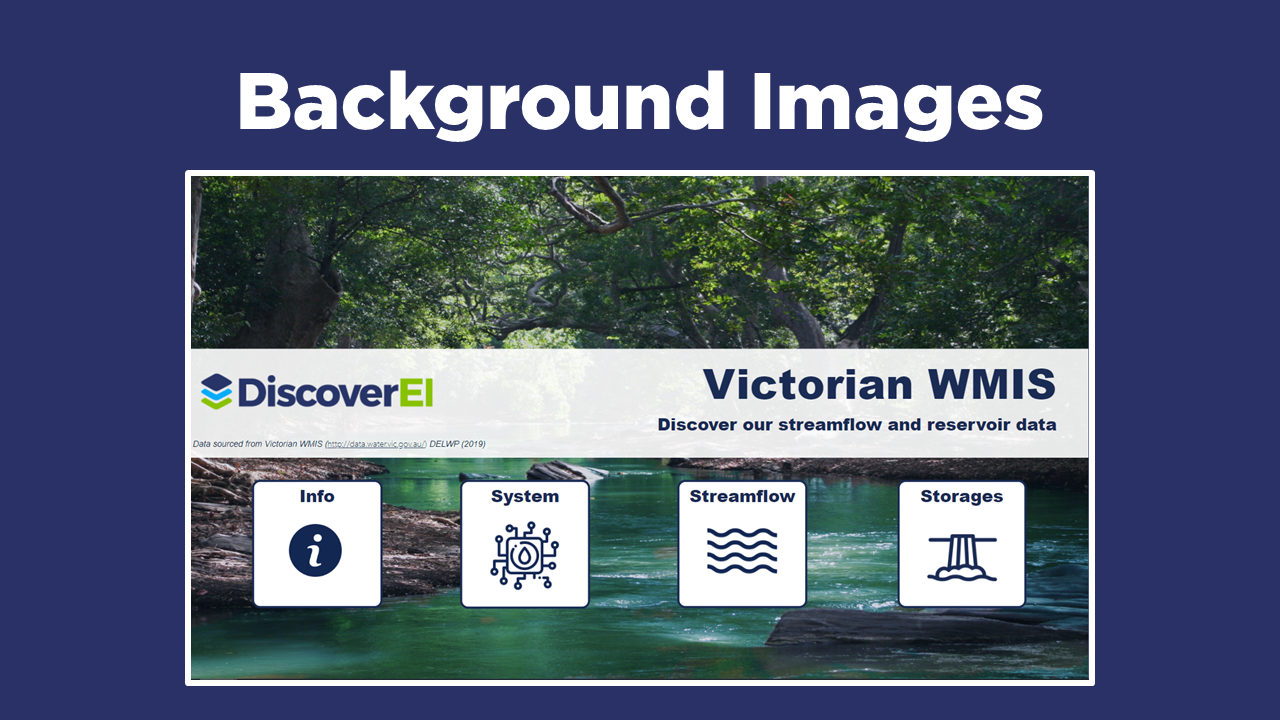
An image can also be used as a great background on your Power BI report home page
STEP 3: Host Online
▶️ Skip ahead in the video to Step 3 ▶️
Now that we’ve downloaded lots of cool icons and pictures, the next hurdle is learning how to host them online.
But wait - why do we need to do this? Because the easiest way to get images into Power BI is via linking to image URLs. There are a lot of options out there - but if you’re looking for a quick and easy way to get started, then look no further than…ImgBB!
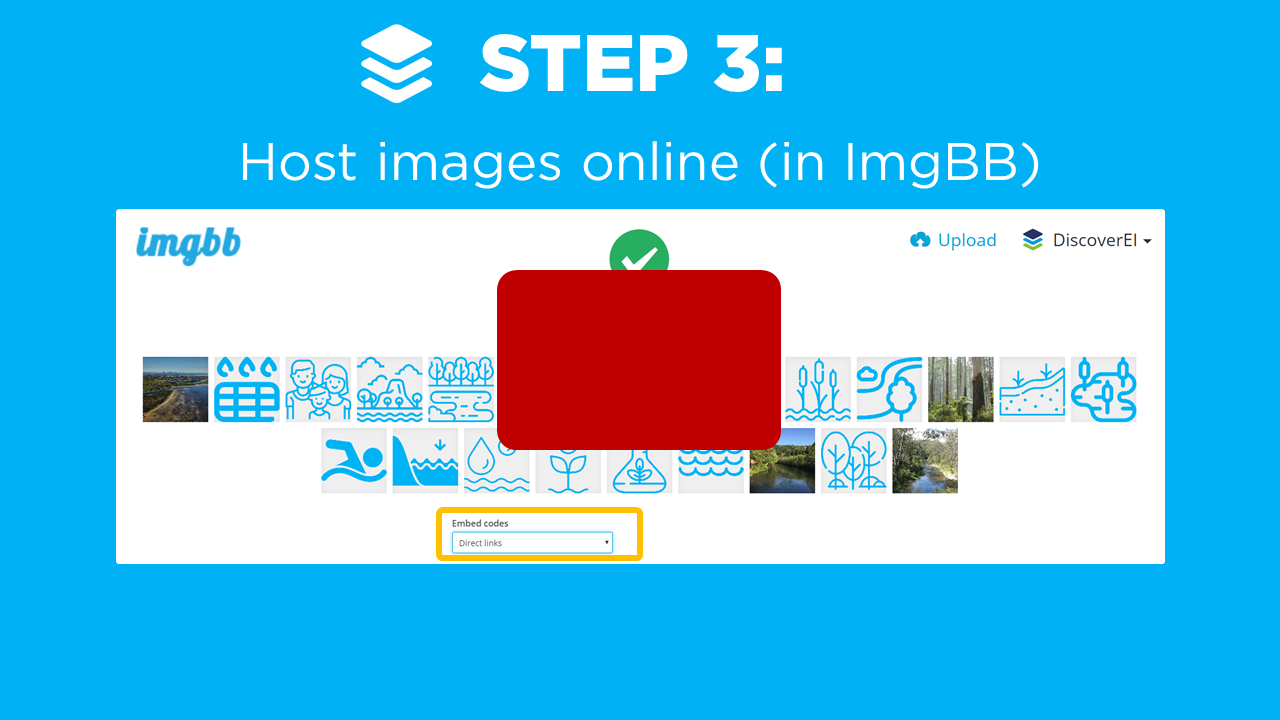
ImgBB is solely an image hosting service. It has a 16MB limit per image and works with JPG, PNG, BMP, and GIF files. It's fast and has user-friendly drag-and-drop functionality. It is that simple to use:
Drag images into an album (Note you can set the album to private if the photos are confidential).
Copy the embed codes as Direct Links
Paste links as a column in your underlying dataset
In some cases you may not want to use a third party website to host images, so in this instance we recommend using:
Microsoft OneDrive: check out this great blog post by Gilbert from FourMoo
Microsoft Azure: as demonstrated in this great video by Guy in a Cube.
STEP 4: Add to Power BI
▶️ Skip ahead in the video to Step 4 ▶️
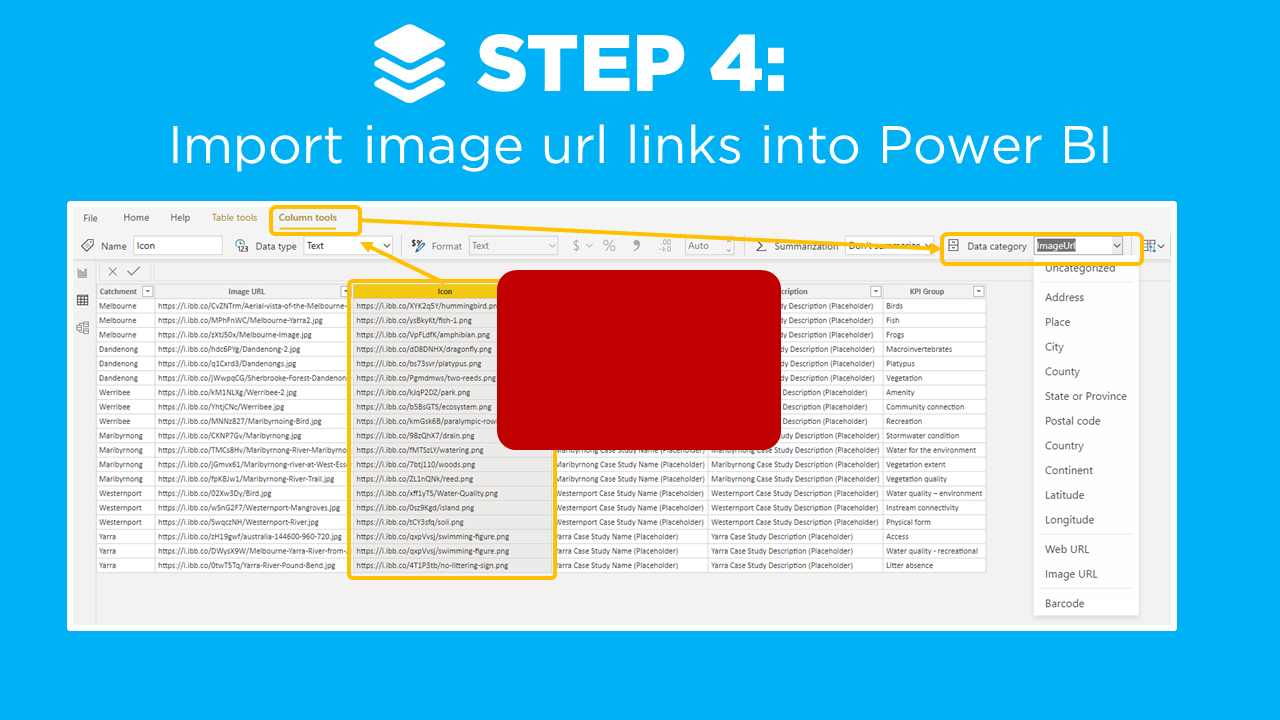
Now that we have our Image URLs in our datasets - we just need to import these into Power BI and start adding images into our reports. The key steps are:
Import the dataset into Power BI
Set the data category for the column to Image URL
Start adding images into your reports!
Beware - some of our key learnings from combining images inside of Power BI are:
Viewing offline: As we’re connecting to online images these won’t be available when your reports are viewed offline.
Broken image links: Make sure to keep track of where you are using image links in your reports so that the links don’t get broken.
Slow loading time: Large images reduce your report performance. It’s always a good idea to compress images first (TinyPNG or WebsitePlanet can help you out here).
And there you have it, Image URLs in your Power BI reports. But now what is the best way to visualise them?
STEP 5: Visualise
▶️ Skip ahead in the video to Step 5 ▶️
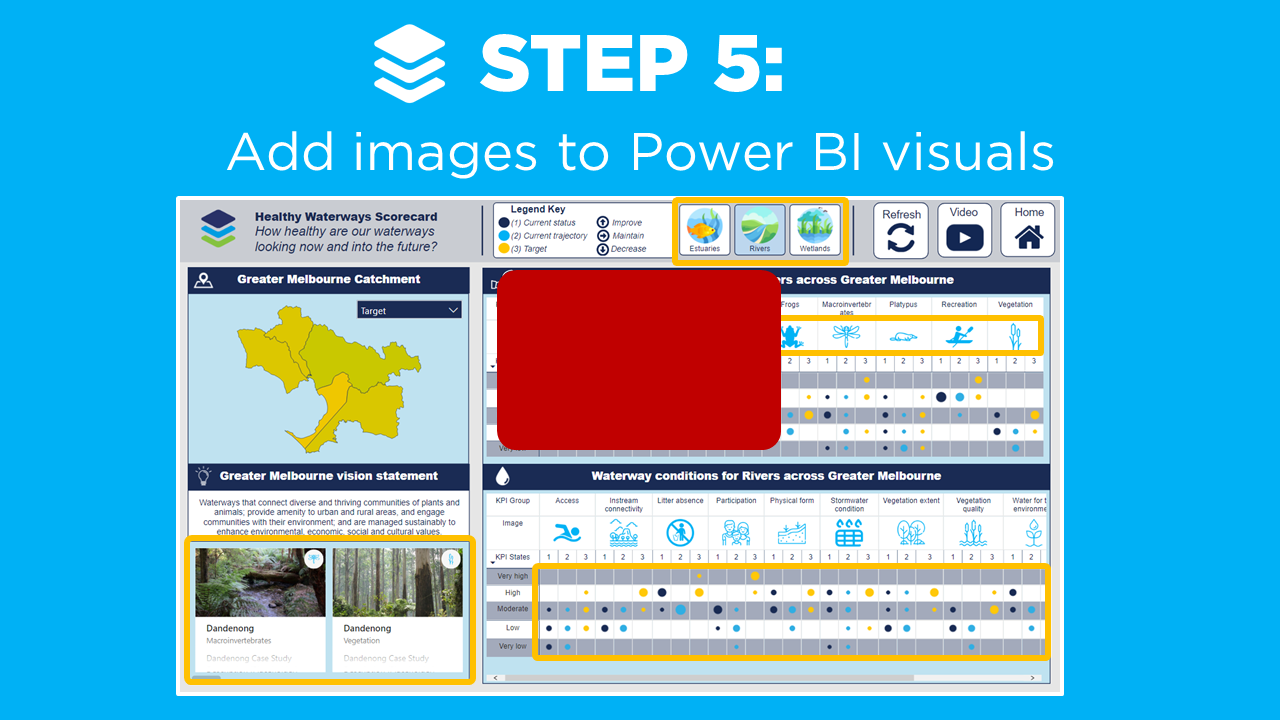
Now the fun really begins - and we’re ready to add images into our Power BI visuals! There are plenty of ways to use images in the standard and custom visuals, including:
Matrix Visual: Drag your Image URL into a matrix row or column to provide greater context, and help users interpret your data.
Chiclet Slicer: This is definitely one of our favourite custom visuals, which we often use to convert an ordinary slicer into a visual representation of categories.
Card Browser: Another great custom visual where you can display your qualitative datasets as image galleries and flip cards.
Now that we have our icons and Image URLs - we can also start taking advantage of some of the more advanced features of Power BI, such as creating our own custom icons in Power BI! All you have to do is add your icon Image URLs into your Power BI theme file, to have an endless supply of icons to play with! For more information on this, head across to Matt Allington’s blog post on how to create your own icon sets.
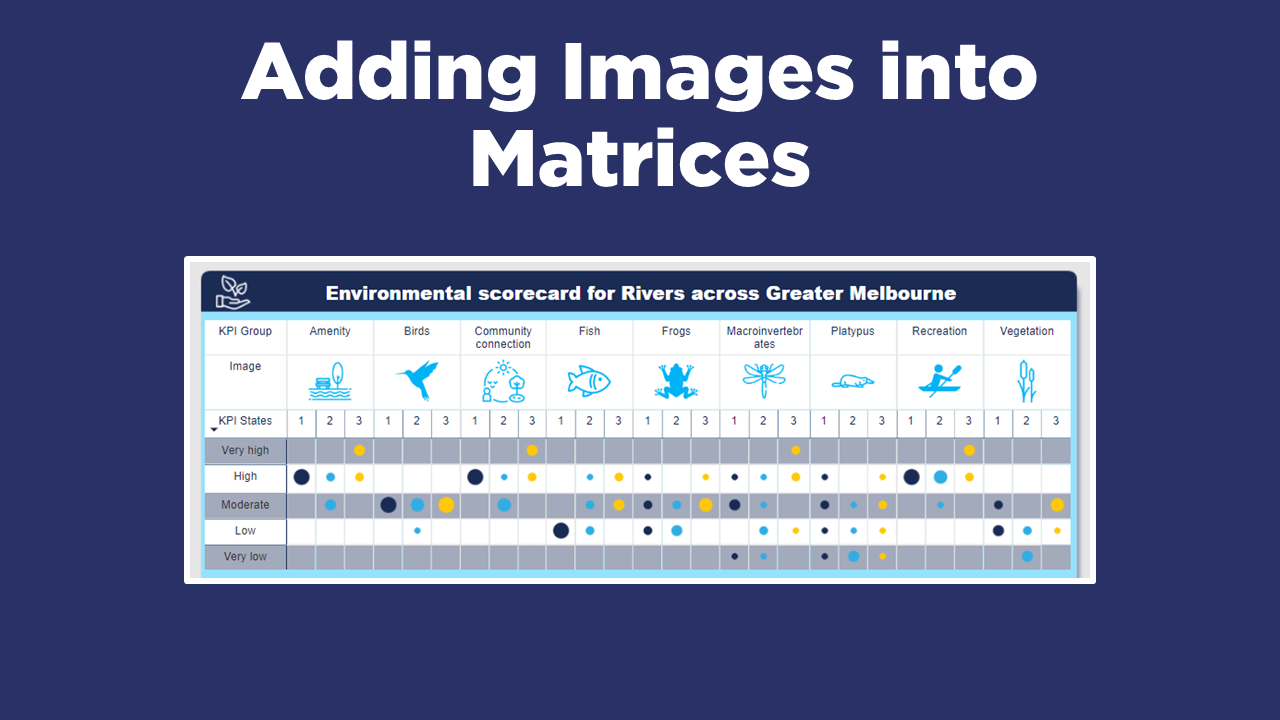
Adding images into matrix columns quickly provides a connection to what the data means.
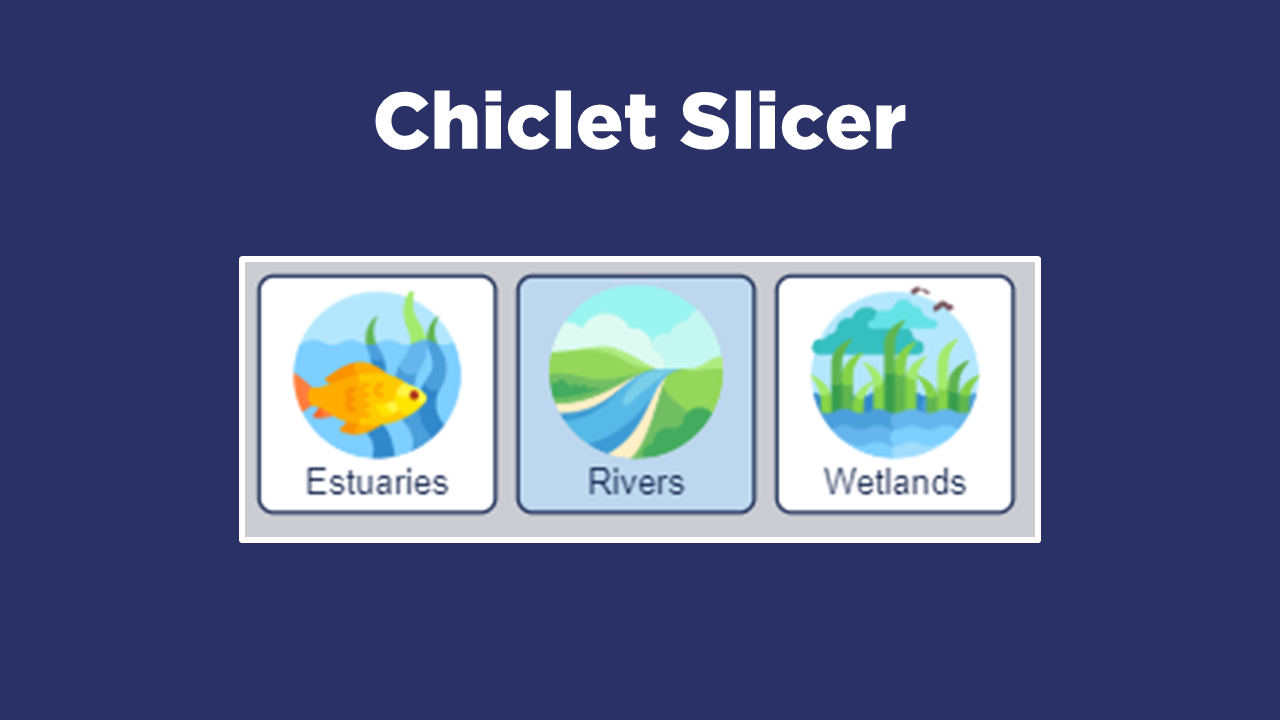
Here we use images in the chiclet slicer to help users select which waterway we are interested in.

The card browser is a great visual for turning tables into image galleries.
Image Gallery
Now that you know how to find, host and embed images into Power BI - below are a few examples of how we use images to bring our reports to life. Head across to our YouTube channel for lots more examples!


In Summary…
By applying these 5 simple steps you too can bring your reports to life through the power of icons and images.
Head across to the Power BI Data Stories Gallery to play around with our Power BI report for yourself!!

Do you have your own awesome examples for using images and icons in Power BI?
We would love to hear them so please share any comments below, or get in touch today!
Power BI Training Courses
We’re really excited to announce the DiscoverEI teams virtual 2-day Power BI training courses, to fast-track your Power BI journey. Click on the links below to learn more, or get in touch today!


Do you want to learn how to design engaging and intuitive Power BI reports, which communicate your key insights at a glance and tell your data story?
Our two-day Power BI training course is designed specifically for Power BI Professionals and Data Analysts, and provides our best practice tips, tricks and hacks to help you transform your data! We provide this course online, in-person group sessions, or customised in-house training for your team. Places are limited (max 8 participants per class) so secure your spot today!