
Mapping Masterclass: Power BI and Data Analytics for Enviro’s (Jan 2021)

🎦 Check out the full event recording here 🎦
The "Power BI and Data Analytics for Enviros" meetup group is all about sharing tips, tricks and hacks for analysing, visualising and communicating environmental data. In our first session back for the year in January, we had three presentations that took us into the world of mapping. The purpose of this blog is to summarise the key take-aways from each of the presenters, to help with sharing knowledge, empowering others and creating a strong data culture within our community.
You can watch the entire recording in the video above, or skip ahead to the sections that interest you by clicking on the individual videos below. The blog is connected to our Meetup group and YouTube channel recording, so we would LOVE to have you subscribe to these and become part of our growing community 😊.
Group Intro & A Fun Quiz…
Christian Borovac (DiscoverEI)
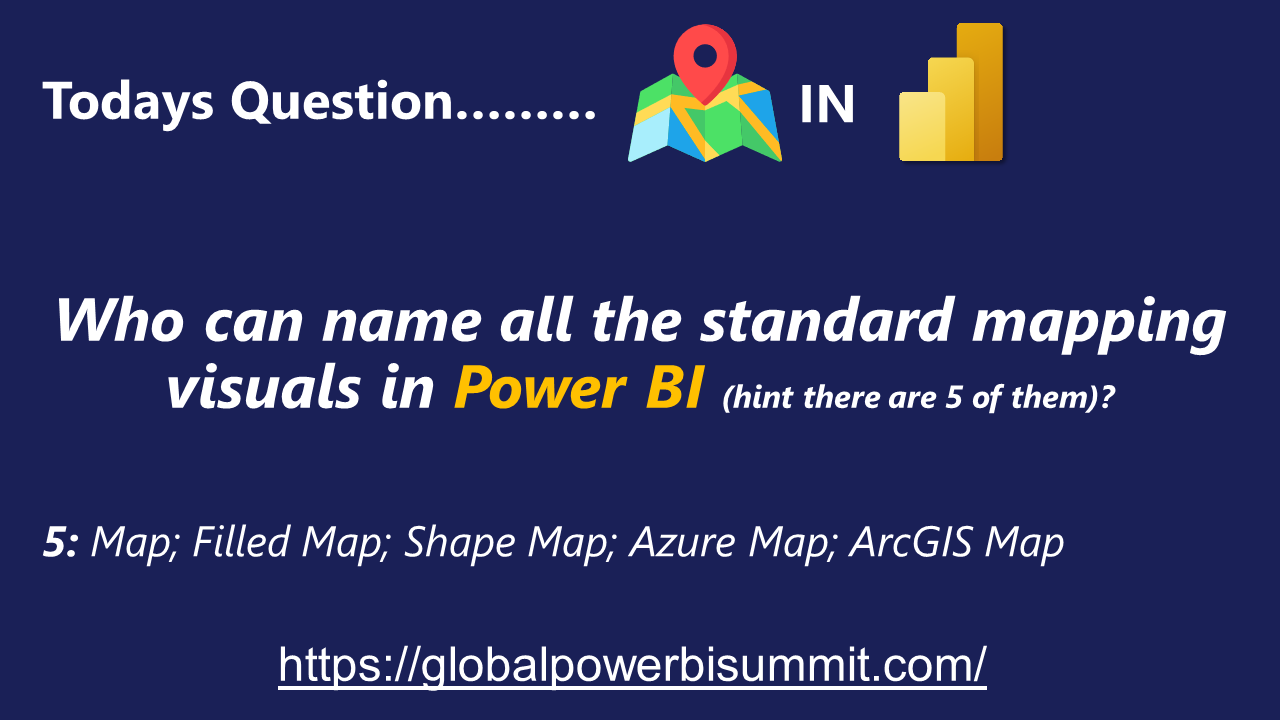
▶️ Listen to Christian introduce the group and run through the quiz held for a great prize, the RADACAD academy one-month subscription ▶️
Reza Rad and Leila Etaati from RADACAD generously provided a one-month subscription to the RADACAD academy online learning library, which is a fantastic resource to learn about Power BI, custom visual development, SQL and so much more. Congratulations to Ayman Alafifi from Seattle in Washington for winning this months’ prize (as shown in the image to the right)
Daniel Marsh-Patrick also has an excellent course the RADACAD Academy all about “How to Build Custom Visuals” which we would highly recommend for anyone interested!
The RADACAD team are also running the Power BI Summit online conference in April, so make sure to register to hear from some of the best global speakers talk about Power BI.
An Icon Map deep-dive!
Alice Drummond (DiscoverEI)

▶️ Skip ahead to Alice’s session ▶️
What is the Icon Map and why should I use it? These are the questions that Alice set off to answer in this fast-paced demo heavy session which takes you through from start to finish how to use it. Developed by James Dales out of the UK, the icon map allows you to combine polygons, polylines and points within Power BI all on your one map. It also lets you take full advantage of the online Mapbox Studio to develop your own custom tilesets.
Watch the video to hear about the 7 Key Steps for getting started with the Icon Map!!
Unpacking the MapBox API
Idris Syed (City of Melbourne)

▶️ Skip ahead in the video to see Idris’ session ▶️
In this part of the recording, Idris from the City of Melbourne gave an overview of another much loved mapping visual within Power BI, the Mapbox custom visual. With some complexity in how to set it up and visualise your data, Idris takes us through a worked example to show how you can automate your spatial dataflow using the Mapbox API feature.
Using Carto for interactive maps
Chandni Gupta (Mosaic Insights)

▶️ Skip ahead in the video to see Chandni’s session ▶️
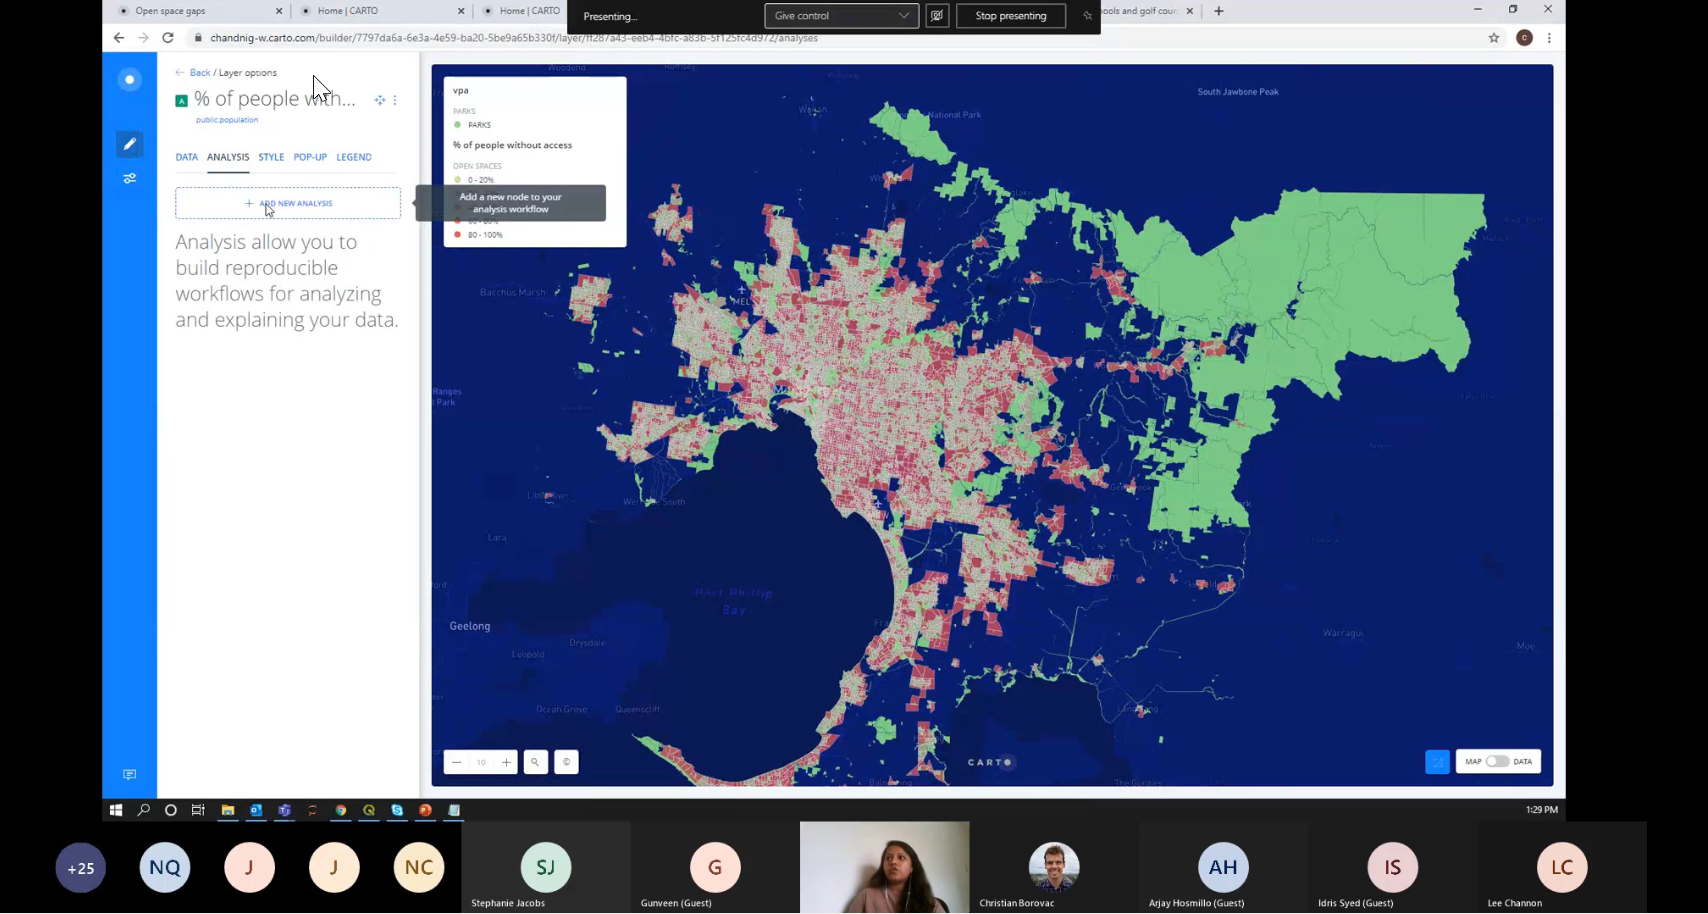
And lastly we had Chandni taking us away from mapping in Power BI, by showing a demo example of Carto. She walked through a real project example completed in 2020, to spatially visualise postcodes across Greater Melbourne to analyse their specific distance to public open space. This was particularly important during the Stage 4 COVID-19 lockdown restrictions that Melbourne endured during the year. Following the session, Chandni shared these links to help you with your Carto map development (thanks Chandni!!):
Accessing Cartoframes: https://carto.com/cartoframes/
Carto connectivity: carto.com/connect/
Carto builder: https://carto.com/builder/
Carto Map: https://chandnig.carto.com/builder/36a1d168-a907-4326-95fa-31b5c95b95ad/embed
Chandni’s project on the Public Open Space article: https://mosaicinsights.com.au/allowing-public-access-to-schools-and-golf-courses-could-deliver-30-million-of-health-and-community-benefits/
How to embed a Carto map into Power BI: https://www.youtube.com/watch?v=syzA3PZx3qk.

Our next session is on 24 February 2021, where we will have Michael Berry presenting on his Makeover Monday Climate Change Power BI dashboard, focusing on some cool data visualisation techniques. We will then have an open Q&A to the audience, where we would encourage you to put your video on, come off mute and have a chat with some Power BI experts on the call 😊!
More information on the session is available through the following link.

Power BI Training Courses
If you’re interested in learning from our team, then we have a range of 2-day Power BI training courses available to fast-track your Power BI journey.
Click on the links below to learn more, and get in touch with the team today!
Purchase Training


Do you want to learn how to design engaging and intuitive Power BI reports, which communicate your key insights at a glance and tell your data story?
Our two-day Power BI training course is designed specifically for Power BI Professionals and Data Analysts, and provides our best practice tips, tricks and hacks to help you transform your data! We provide this course online, in-person group sessions, or customised in-house training for your team. Places are limited (max 8 participants per class) so secure your spot today!