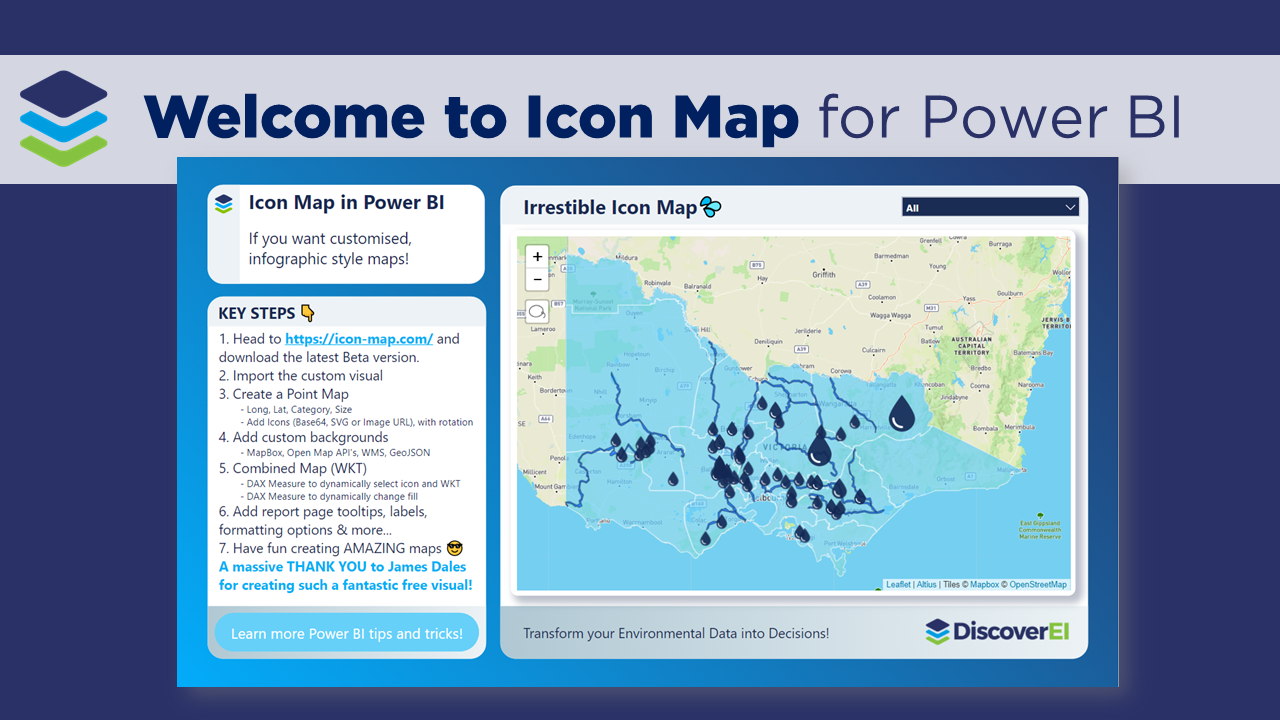
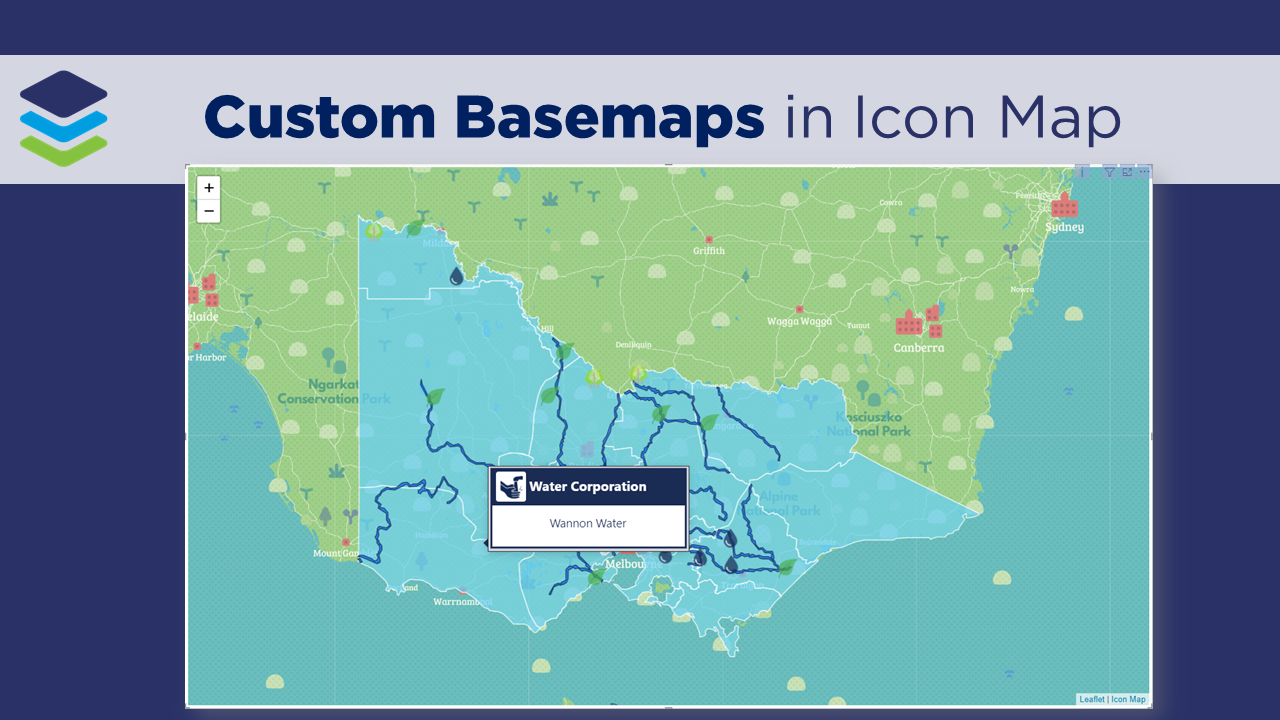
Posts in Icon Map
Welcome to Icon Map for Power BI

Working across the environmental industry – it’s fair to say that pretty much ALL of DiscoverEI’s Power BI reports have a map! And if you thought that MapBox was good, well you’re going to LOVE the Icon Map custom visual in Power BI – which allows you to display interactive polygons, points, lines and of course – icons, all in the one visual…plus so much more! To really appreciate how Icon Map can be used to visualize real world data, in this video blog I walk through two real-world applications of Icon Map to visualize environmental data. A big shoutout and thanks to James Dales for creating this awesome visual!!

Read More