Posts tagged Icon Map
The next generation of maps for Power BI with Icon Map Pro

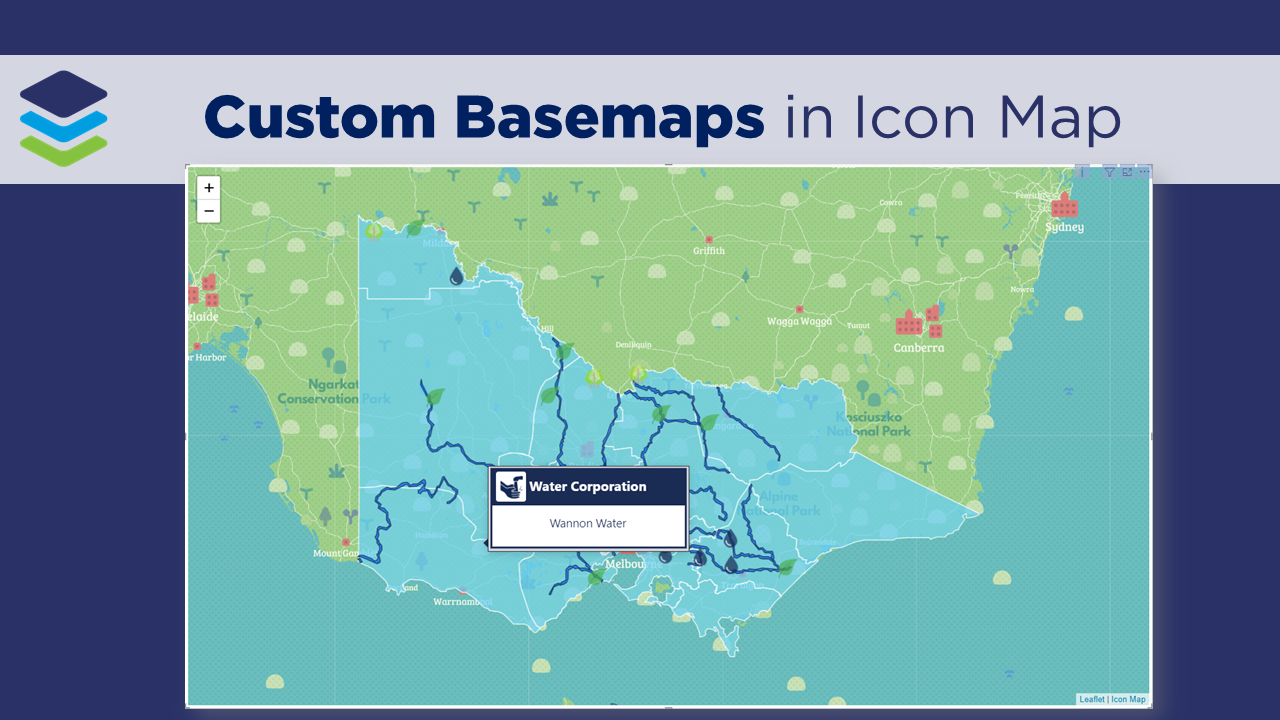
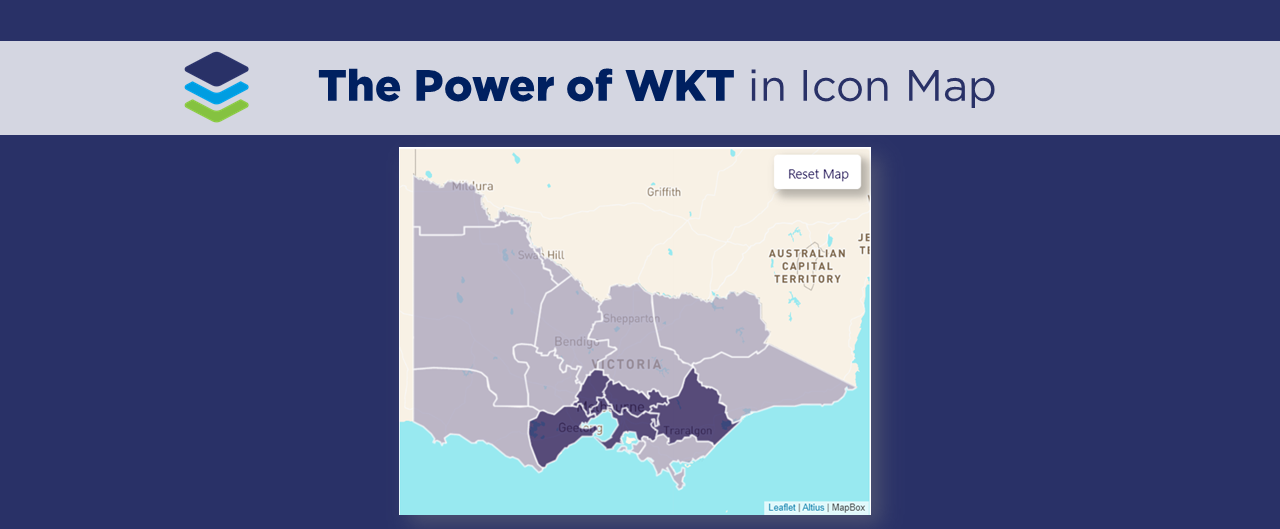
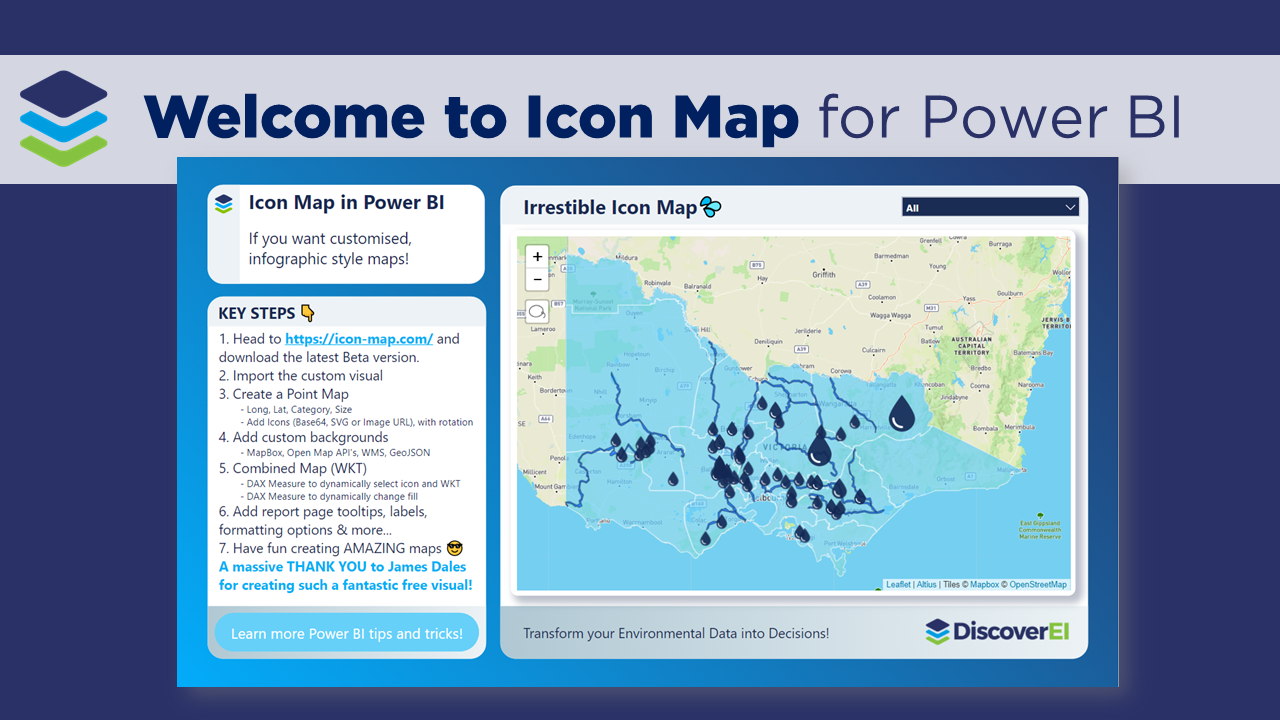
In this session James Dales dived into his new custom visual: Icon Map Pro. James showed how to achieve some of the more advanced mapping requirements in Power BI. The new Icon Map Pro visual opens up more opportunities for creating more complex geospatial visuals. For example working with your own polygons to create choropleth maps, drawing lines, shapes and images to create interactive utility network diagrams and clustering data using the H3 hexagon grid system.

Read More
Welcome to Icon Map for Power BI

Working across the environmental industry – it’s fair to say that pretty much ALL of DiscoverEI’s Power BI reports have a map! And if you thought that MapBox was good, well you’re going to LOVE the Icon Map custom visual in Power BI – which allows you to display interactive polygons, points, lines and of course – icons, all in the one visual…plus so much more! To really appreciate how Icon Map can be used to visualize real world data, in this video blog I walk through two real-world applications of Icon Map to visualize environmental data. A big shoutout and thanks to James Dales for creating this awesome visual!!

Read More