
Environmental Data Storytelling - Gippsland Water's Urban Water Strategy: Power BI and Data Analytics for Enviro’s (September 2021)
The "Power BI and Data Analytics for Enviros" meetup group is all about sharing tips, tricks and hacks for analysing, visualising and communicating environmental data. The purpose of this blog is to summarise the key take-aways from each of the presenters, to help with sharing knowledge, empowering others and creating a strong data culture within our community.

🎦 Check out the full event recording here 🎦
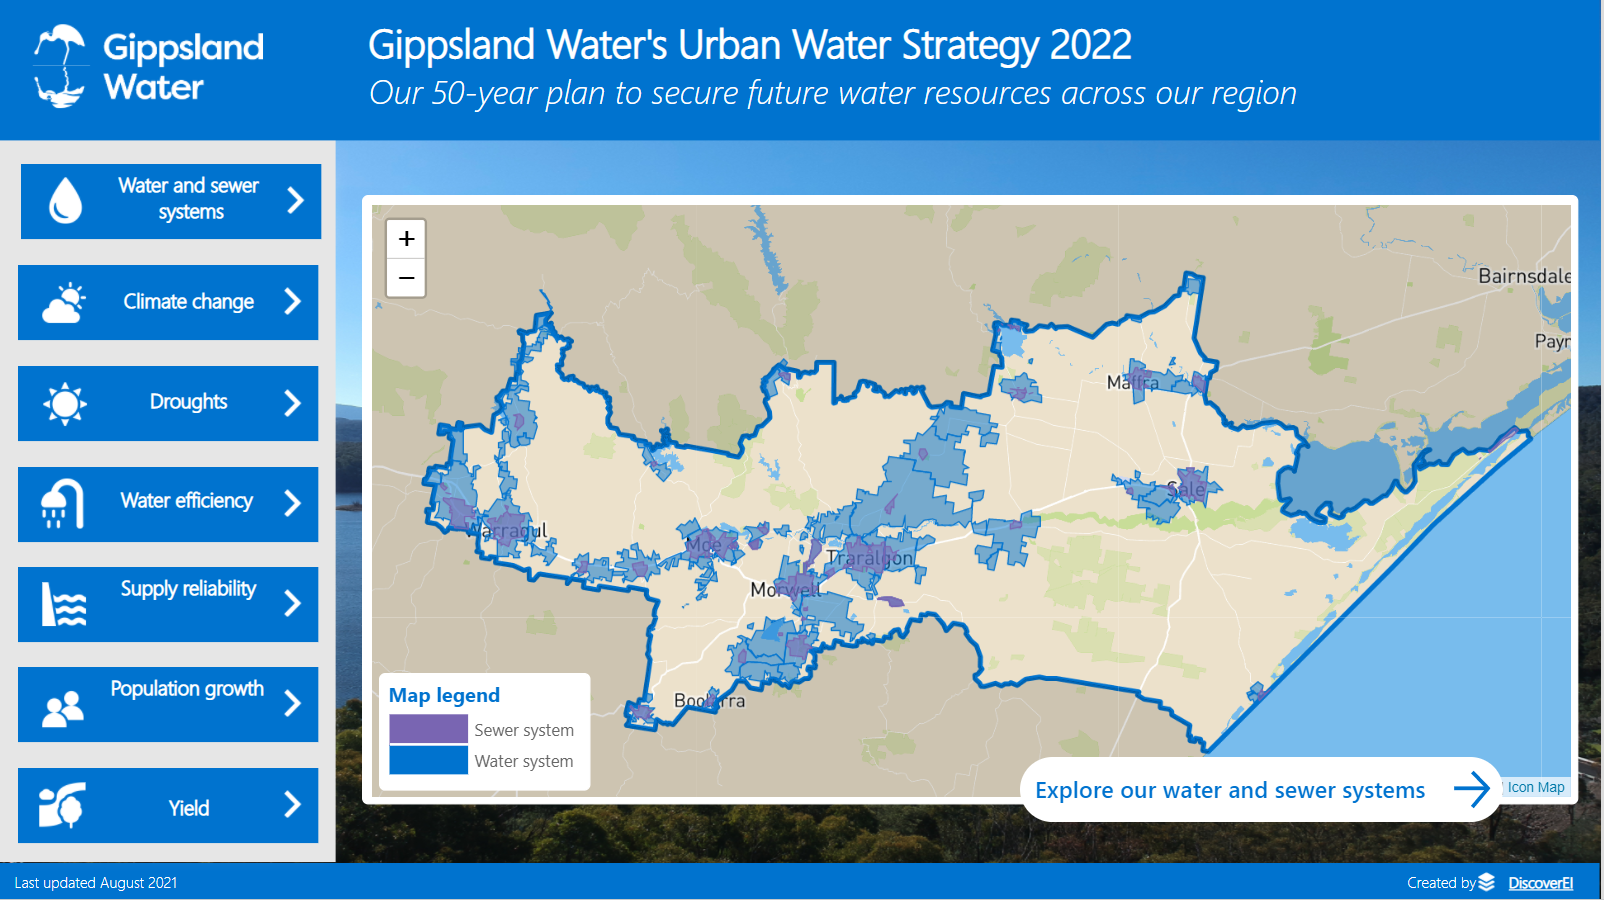
In September we were lucky to have Jolyon Taylor and Catherine Couling from Gippsland Water join us, to talk about the recently released Power BI report used as a supporting tool to communicate Gippsland Water's 2022 Urban Water Strategy (UWS), which is an interactive dashboard available for the public: https://www.gippswater.com.au/uws. Catherine and Jolyon presented the vision behind the tool, the journey the Gippsland Water team went on during the Power BI development process and the benefits they have seen so far in presenting this data through an interactive dashboard, and the community response to learning where their water comes from and where their sewerage goes. Christian and Alice also then presented some more of the technical elements behind the report design, especially the use of custom visuals, navigation buttons and accessibility considerations.
You can watch the entire recording in the video above, or skip ahead to the sections that interest you by clicking on the individual videos below. The blog is connected to our Meetup group and YouTube channel recording, so we would LOVE to have you subscribe to these and become part of our growing community 😊.
Gippsland Water's Urban Water Strategy
Jolyon Taylor and Catherine Couling
Hear from Jolyon and Catherine as they take us through the ideas for the original concept design of the dashboard, the teams vision on how this tool can be used for stakeholder engagement and the journey they took in designing and developing it.

▶️ Take a listen to the session here ▶️
Power BI Techniques for the UWS Dashboard
Christian Borovac and Alice Drummond
Christian and Alice followed on from the Gippsland Water team by talking about some of the awesome Power BI features built into the Power BI dashboard. From interactive infographics using Synoptic Panel, custom maps using the Icon Map and navigation features through buttons and bookmarks there is a lot available for us these days as Power BI report developers.
And in October, we’re going to Brazil (virtually of course), to hear from the team at Cetrel on some of their Power BI applications they have created for the environmental industry - don’t forget to sign up for the event here: https://www.meetup.com/en-AU/powerbi4enviros/events/280782507/
Please note this will be a BREAKFAST session starting at 9:00am for all people dialling in from the AEST timezone

Sign up now for the meetup where we continue to announce new sessions to round out 2021: https://www.meetup.com/en-AU/powerbi4enviros - and if you have ideas for a future session then please let us know at info@discoverei.com .
Power BI Training Courses
If you’re interested in learning from our team, then we have a range of 2-day Power BI training courses available to fast-track your Power BI journey.
Click on the links below to learn more, and get in touch with the team today!
Purchase Training


Do you want to learn how to design engaging and intuitive Power BI reports, which communicate your key insights at a glance and tell your data story?
Our two-day Power BI training course is designed specifically for Power BI Professionals and Data Analysts, and provides our best practice tips, tricks and hacks to help you transform your data! We provide this course online, in-person group sessions, or customised in-house training for your team. Places are limited (max 8 participants per class) so secure your spot today!